What is HbA1c blood test?
HbA1c (glycated haemoglobin) is the proportion of haemoglobin molecules in red blood cells that have glucose attached. Because red blood cells circulate for about 8 to 12 weeks, HbA1c serves as an integrated measure of average blood-glucose exposure over those months.
Why does it matter for long-term health and wellbeing?
HbA1c gives a stable window into how well your metabolism handles glucose over time. Excessive fluctuations or persistently elevated levels place more demand on regulatory systems, can stress energy control mechanisms, and may undermine metabolic flexibility. By monitoring HbA1c, you gain insight into how lifestyle inputs (food, movement, sleep, stress) are shaping your internal balance — allowing earlier adjustments to support vitality and longevity.
What’s an optimal level of HbA1c? (and lab ranges)
In Vively’s internal scaling:
- 20 % = > 10 %
- 40 % = 6.5 – 10 %
- 60 % = 6.0 – 6.5 %
- 80 % = 5.7 – 6.0 %
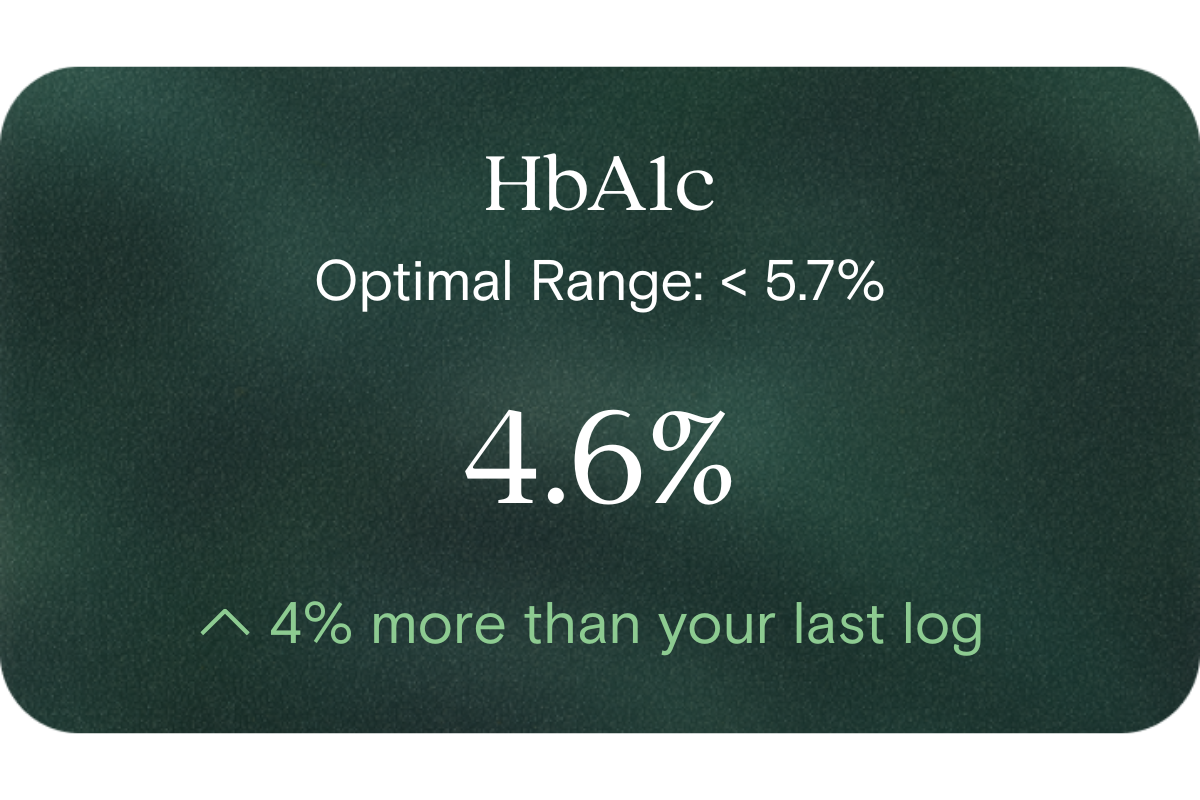
- 100 % = < 5.7 %
(Thus, the “100 %” ideal corresponds to HbA1c below 5.7 %)
In Australian pathology practice, a “normal” or reference interval often spans ~3.5 % to 6.0 % (15–42 mmol/mol).
The Australian Diabetes Society and diagnostic guidance use a threshold of ≥ 6.5 % (≥ 48 mmol/mol) as a marker of elevated glycaemic load.
In Vively, values under 5.7 % (i.e. the “100 %” segment) align with optimal metabolic balance; values between 5.7 % and 6.5 % (i.e. 60-80 % scale) suggest room for improvement; values above 6.5 % (lower scale percentages) indicate that key lifestyle levers deserve attention.
What influences HbA1c levels?
- Dietary carbohydrate quality, quantity and timing (e.g. refined carbs, post-meal spikes vs slower absorption)
- Physical activity and muscle insulin sensitivity
- Sleep duration, circadian alignment and stress hormones
- Body composition (especially visceral fat) and insulin sensitivity
- Red blood cell turnover, iron status, vitamin B12/folate status, and conditions that alter RBC lifespan or haemoglobin structure (which may distort HbA1c interpretation.
What does it mean if HbA1c is outside the optimal range?
If your HbA1c is higher than ~5.7 %, this suggests that average glucose exposure is above ideal, meaning regulatory systems are working harder to maintain balance. It doesn’t necessarily imply disease — instead, it’s a signal to adjust lifestyle levers early. Consistently elevated HbA1c is a risk marker for metabolic strain over time. If HbA1c is much lower than expected, it could reflect unusually short RBC lifespan or laboratory artefact, and warrants checking measurement validity.
How can I support healthy HbA1c levels?
- Choose low-glycaemic, nutrient-dense carbohydrate sources, and avoid frequent sugar/ refined carb spikes
- Combine resistance training and aerobic movement to boost glucose uptake
- Prioritise consistent, restorative sleep and circadian regularity
- Support micronutrient and iron/B12 balance (so red blood cell health is optimal)
- Manage stress (e.g. via mindfulness, gentle movement) to modulate cortisol effects
- Monitor changes over time; adjust diet, exercise, sleep, and recovery based on your trend data
Tracking HbA1c isn’t about waiting until something is broken — it’s about giving you a forward-looking measure so you can refine your metabolism, sustain your energy system, and guide lifestyle evolution before strain becomes entrenched. Start measuring and tracking today for clearer insights and smarter, earlier decisions.
This information is provided for general health and wellness purposes only and does not replace medical advice.
FAQs
What is the normal range and normal value of HbA1c
The HbA1c normal range in Australian pathology is usually around 3.5–6.0%. For metabolic optimisation, many clinicians consider a normal value of HbA1c below 5.7% to reflect better long-term glucose balance rather than simply being within the lab reference range.
What does HbA1c mean in IFCC units
HbA1c can also be reported using the IFCC system, expressed in mmol/mol. In this format, values below 39 mmol/mol generally correspond to results under 5.7% and are often considered closer to optimal metabolic balance.
How much does an HbA1c test cost
The HbA1c test price varies depending on whether it is ordered alone or as part of a broader panel. In Australia, private testing commonly ranges from around $20 to $60, while comprehensive health checks may have a higher bundled cost.
Why are there two reporting systems for HbA1c
HbA1c IFCC units (mmol/mol) are used internationally for standardisation, while percentage values remain common in Australian clinical practice. Both systems measure the same marker and can be accurately converted between formats.
References
- Pathology Tests Explained. (2023). HbA1c (Glycated Haemoglobin). Australian Government Department of Health initiative.
- Royal Australian College of General Practitioners (RACGP). (2023). More than just a number: HbA1c in primary care.
- Australian Diabetes Society. (2023). Guidance concerning the use of glycated haemoglobin (HbA1c) for the diagnosis of diabetes mellitus.


.png)

.svg)

