Blood Testing

Copper/Zinc ratio

The Copper/Zinc Ratio is an important biomarker for assessing balance between these essential trace minerals. Both copper and zinc play critical roles in maintaining various metabolic functions, including immune support, antioxidant activity, and the regulation of cellular health. Optimising this ratio contributes to improved energy levels, metabolism, and long-term wellbeing. Testing and tracking this ratio can provide valuable insights into your body's nutritional balance, helping you make proactive lifestyle adjustments for better health outcomes. Monitoring your copper/zinc ratio is an effective way to optimise energy, performance, and longevity.

Book My Test
Book My Test
Instant pathology referral | 4,000+ Testing Locations in AU | Results in 2-3 days
Order My CGM

What is Copper/Zinc Ratio?

The copper/zinc ratio is a measure of the relative amounts of copper and zinc in the body. These minerals work in tandem to support immune function, cellular health, and antioxidant activity. Maintaining a proper balance between them is vital for overall wellbeing.

Why does it matter for long-term health and wellbeing?

An optimal copper/zinc ratio helps maintain energy levels, metabolic function, and cellular health. This ratio influences key processes like immune response and oxidative stress, both of which are essential for long-term vitality and wellness.

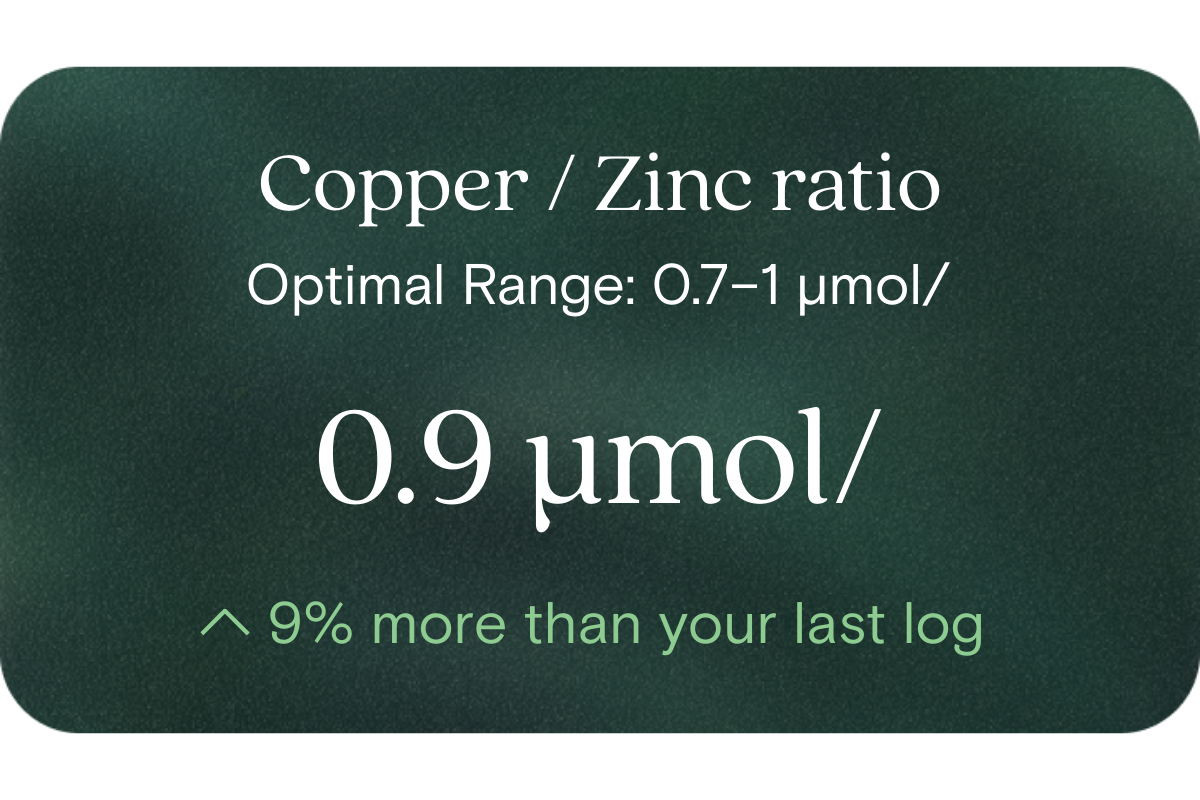
What's an optimal level of Copper/Zinc Ratio?

While optimal ranges can vary, the ideal copper/zinc ratio for health is typically 1:1 to 1:1.5. In general, Australian laboratories often report reference ranges with copper levels between 11-22 μmol/L and zinc levels between 8-15 μmol/L. Optimal values should fall within these ranges to support proper physiological function.

What influences Copper/Zinc Ratio levels?

Diet, lifestyle, and stress levels can all influence copper and zinc levels in the body. Excessive intake of copper or insufficient zinc intake, stress, or even certain medications can impact the balance of these minerals.

What does it mean if Copper/Zinc Ratio is outside the optimal range?

If your copper/zinc ratio falls outside the optimal range, it may indicate an imbalance that could affect your metabolic and immune functions. Tracking this ratio helps identify areas to focus on for lifestyle adjustments, such as dietary improvements or stress management.

How can I support healthy Copper/Zinc Ratio levels?

Supporting healthy copper and zinc levels can be achieved through a balanced diet, rich in foods like shellfish, nuts, seeds, and leafy greens. Managing stress and ensuring adequate sleep also play important roles in maintaining the optimal copper/zinc ratio.

References:

  1. National Health and Medical Research Council (NHMRC). Nutrient Reference Values for Australia and New Zealand. Official guidelines for nutrient intake, including copper and zinc. 
  2. Healthdirect Australia. Zinc and your health. Australian government resource on zinc’s role and importance.
  3. Mravunac, M. et al. (2019). Greater circulating copper concentrations and copper/zinc ratios are associated with lower psychological distress in Australian adults. Nutrients, 11(10):2503. 
  4. Zhang, H. et al. (2021). Study on reference range of zinc, copper, and copper/zinc ratio in childbearing women. Nutrients, 13(3):759. 

Full Body Health Check

Discover 80+ biomarkers
that shape your health

Take the test
Biological Age
1 marker

Biological age

A reflection of how your body is aging at the cellular level, linked to age risks and longevity.
Red Blood Cell (RBC) Count
Haemoglobin
Haematocrit
Mean Cell Volume (MCV)
Mean Cell Haemoglobin (MCH)
Mean Cell Haemoglobin Concentration (MCHC)
Red Cell Distribution Width (RDW)
Platelet Count
8 markers

Blood health

Key blood indicators like hemoglobin, inflammation, and oxygen transport for overall health.
Cholesterol Ratio
HDL Cholesterol
LDL Cholesterol
Non-HDL Cholesterol
Total Cholesterol
Triglycerides
6 markers

Heart health

Assesses cardiovascular health through cholesterol, lipids, and heart-related risk markers.
Cortisol
Dehydroepiandrosterone Sulfate (DHEA-S)
Free Thyroxine (T4)
Free Triiodothyronine (T3)
Thyroid stimulating hormone (TSH)
5 markers

Hormone balance

Evaluates hormone levels that impact energy, sleep, mood, and metabolism.
White Blood Cell (WBC) Count
Neutrophils
Lymphocytes
Monocytes
Eosinophils
Basophils
6 markers

Immune system

Measures immune activity and inflammatory responses to assess body defenses.
High-Sensitivity C-Reactive Protein (hs-CRP)
1 marker

Inflammation status

Tracks signs of chronic or acute inflammation that may affect long-term disease risk.
Bicarbonate
Chloride
Creatinine
Potassium
Sodium
Urea
Uric acid
Anion Gap
Estimated Glomerular Filtration Rate (EGFR)
9 markers

Kidney function

Assesses kidney health through creatinine and other markers of blood filtration.
Alanine Aminotransferase
Albumin
Alkaline Phosphatase
Aspartate aminotransferase (AST)
Bilirubin
Gamma-glutamyl Transferase (GGT)
Globulin
Total Protein
8 markers

Liver health

Measures liver enzymes and proteins responsible for detoxification and metabolic health.
Fasting Glucose
Fasting Insulin
Haemoglobin A1c (HbA1c) IFCC mmol/m
Haemoglobin A1c (HbA1c) NGSP/DCCT %
HOMA-IR score
5 markers

Metabolic health

Evaluates energy processing with glucose, HbA1c, insulin, and related biomarkers.
Magnesium
1 marker

Vitamins & minerals

Analyzes essential nutrients that support immunity, energy, and overall wellbeing.
Creatine Kinase
1 marker

Muscle strength

Assesses biomarkers related to muscle performance, function, and recovery.
Biological Age
1 marker

Biological age

A reflection of how your body is aging at the cellular level, linked to age risks and longevity.
How it works

Get a clearer picture of your health today

01

Schedule your test

Visit one of 4,000 collection centres across Australia at your earliest convenience and take one blood draw
02

Get your results

Review your 80+ biomarkers in the Vively app and get a full breakdown, including your Biological Age and Speed of Ageing.
03

Take control of your health

Track and improve your health through the app, with expert 1:1 support available with dietitian coaches to guide healthy changes
FAQ

Got Questions? We’ve Got Answers

What's included in the blood test?
How is this different from getting a blood test at my GP?
What is the Vively membership?
Why do you test these specific biomarkers?
What happens to my data?