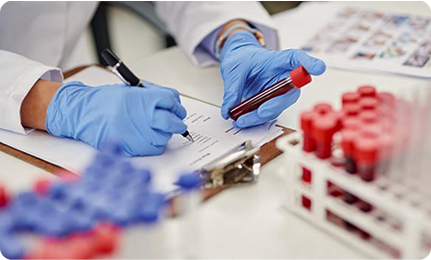
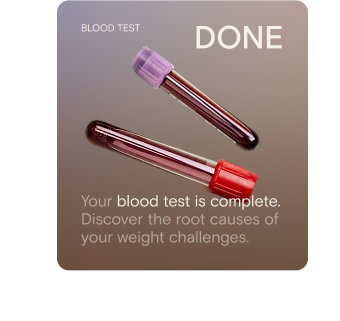
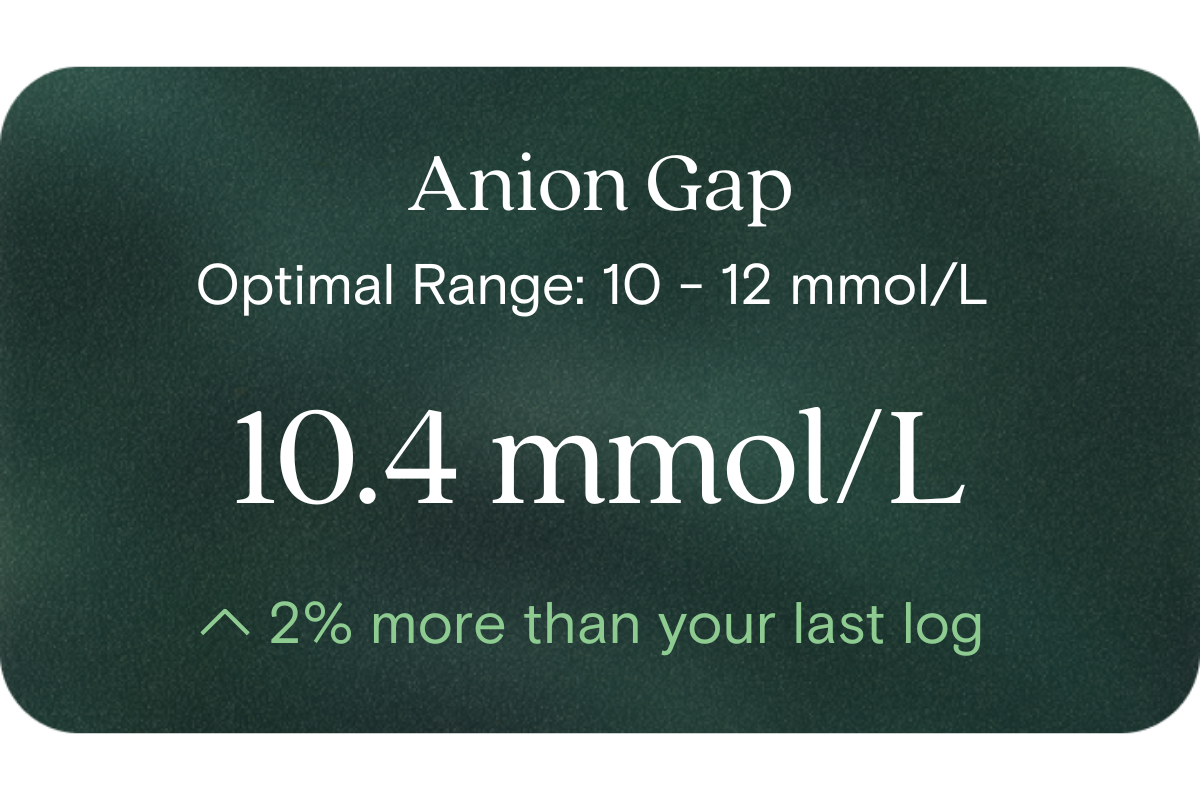
All Tests
/
Blood Testing
/
Anion Gap
Blood Testing

Anion Gap

Anion Gap is a calculated electrolyte marker reported on an electrolytes panel or Urea, Electrolytes and Creatinine (UEC) test, using sodium, potassium, chloride and bicarbonate (mmol/L) to assess acid–base balance. Anion Gap levels may rise with metabolic acidosis, including diabetic ketoacidosis, lactic acidosis, kidney impairment, or toxin exposure, and may be lower with low albumin (hypoalbuminaemia) or analytical variation. This matters because acid–base disruption can affect energy production, mental clarity, breathing pattern, and exercise tolerance. An Anion Gap blood test is best interpreted alongside bicarbonate, chloride, creatinine, glucose, ketones, lactate and albumin to identify the likely driver.
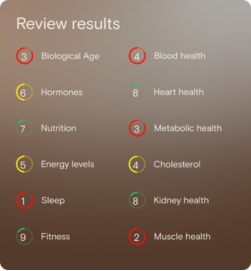
Anion Gap is now available in Vively baseline health check test, along with 70+ important health markers. Book your test today for only $99.
Book My Test
Book My Test
Same-day pathology referral | 4,000+ Testing Locations in AU | Results in 2-3 days
Order My CGM

What is the Anion Gap?

The Anion Gap is a calculated marker from your blood test results, showing the difference between your main positive and negative electrolytes:

Anion Gap = (Na + K) – (Cl + HCO₃)

All values are measured in mmol/L.

Why does it matter for long-term health and wellbeing?

It reflects how well your body maintains acid–base balance, a process vital for metabolism, enzyme activity, and cellular energy. Monitoring it through an anion gap lab test helps identify early changes and optimise lifestyle factors for better health.

What’s an optimal level of Anion Gap?

  • Lab (reference) range: 8–16 mmol/L
  • Optimal range: 10–12 mmol/L

What influences Anion Gap levels?

Hydration, electrolyte intake, albumin levels, medications, exercise intensity, and nutrition can all affect the reading.

What does it mean if Anion Gap is outside the optimal range?

A slightly higher or lower value can indicate your body is adapting to changes in hydration, electrolyte balance, or nutrient status. It’s a sign to review lifestyle factors rather than a cause for concern.

How can I support healthy Anion Gap levels?

Stay well-hydrated, eat a balanced diet with fruits and vegetables, manage stress, recover adequately after exercise, and review electrolyte intake when needed.

This information is provided for general health and wellness purposes only and does not replace medical advice.

References

  1. Royal College of Pathologists of Australasia. Anion gap — Reference Interval and Methodology. 
  2. SydPath. Chloride and the Anion Gap Information Sheet (2022).
  3. StatPearls. Anion Gap (DG Pandey et al.).
  4. PathologyTestsExplained. Electrolytes — Anion Gap

What we measure

 70+ biomarkers analysed, each one tells you something specific about how your body is functioning right now, not just whether you're "sick" or "not sick"

Understand markers linked to healthy aging

A reflection of how your body is aging at the cellular level, linked to age risks and longevity.

  • Biological Age
  • Speed of Aging

Understand how your body regulates energy

Review glucose, insulin and lipid markers associated with metabolic balance.

  • Fasting Glucose
  • Fasting Insulin
  • Haemoglobin A1c (HbA1c) IFCC mmol/m
  • Haemoglobin A1c (HbA1c) NGSP/DCCT %
  • HOMA-IR
  • Uric Acid/HDL-C (UHR)
  • TyG index
  • Sodium/Potassium Ratio
  • hs-CRP / HDL Ratio

See how your blood supports oxygen and energy

Key blood indicators like hemoglobin, inflammation, and oxygen transport for overall health.

  • Mean Cell Volume (MCV)
  • Red Blood Cell (RBC) Count
  • Haemoglobin
  • Haematocrit
  • Red cell distribution width (RDW)
  • Mean Cell Haemoglobin (MCH)
  • Mean Cell Haemoglobin Concentration (MCHC)
  • Platelet count

Review advanced cardiovascular risk markers

Analyse lipid balance and related markers linked to long-term heart and vascular wellbeing.

  • Total Cholesterol
  • LDL Cholesterol
  • HDL Cholesterol
  • Non-HDL Cholesterol
  • Cholesterol Ratio
  • Triglycerides
  • Cholesterol/HDL Ratio
  • Total Cholesterol/HDL Ratio
  • LDL/HDL Ratio
  • Triglyceride/HDL Cholesterol (Molar Ratio)
  • Non-HDL Cholesterol/Total Cholesterol (Mass Ratio)

See how your immune system is functioning

Review white blood cell markers that reflect immune activity and response.

  • White Blood Cell (WBC) Count
  • Neutrophils
  • Lymphocytes
  • Eosinophils
  • Basophils
  • Neutrophil-to-Lymphocyte Ratio
  • Neutrophil-to-HDL Cholesterol Ratio (NHR)
  • Platelet/Lymphocyte Ratio
  • Monocytes

Identify markers linked to systemic inflammation

Assess signals associated with inflammatory balance and overall physiological stress.

  • High-Sensitivity C-Reactive Protein (hs-CRP)
  • CRP/Albumin Ratio (CAR)
  • Systemic Inflammation Index (SII)

Monitor markers related to kidney function

Review indicators that reflect how efficiently your kidneys filter and regulate fluids.

  • Chloride
  • Bicarbonate
  • Sodium
  • Potassium
  • Urea
  • Creatinine
  • BUN/Creatinine Ratio
  • Estimated Glomerular Filtration Rate (eGFR)
  • Anion Gap

Assess markers connected to liver health

Understand enzymes and related markers linked to metabolic processing and detoxification pathways.

  • Alkaline Phosphatase
  • Bilirubin
  • Aspartate aminotransferase (AST)
  • Gamma-glutamyl Transferase (GGT)
  • Alanine Aminotransferase (ALT)
  • Globulin
  • Total Protein
  • NAFLD FIB-4
  • Albumin/Globulin Ratio
  • Albumin

Check your thyroid function

Helps identify thyroid issues linked to energy, mood and weight.

  • Thyroid Stimulating Hormone (TSH)

Check key nutrient levels that support daily function

Assess essential vitamins and minerals linked to energy production, recovery and overall wellbeing.

  • Phosphate
  • Magnesium
  • Transferrin
  • Ferritin
  • Transferrin saturation
  • Vitamin D
Get my baseline for $99
Why us?

What a standard check often leaves out

Your GP isn't the problem. The current health system isn't built for optimal health.

Vively
Standard GP check
Markers analysed
70+ markers
10-15 markers
Optimal ranges included
Biological age
Results reviewed with on-demand practitioner support
Personalised plan built around your results
Ongoing retesting and health trends reporting
How it works

Just 3 simple steps to get started

If needed, we'll recommend further testing to investigate potential issues based on your results

01

Take the test

One simple test to understand where your health stands. Visit one of 4,000 collection centres across Australia at your earliest convenience and take one easy blood draw.
02

Review your results

Meet with a registered health professional to identify what looks fine, what’s worth watching, and what (if anything) needs attention. If nothing needs changing, we’ll tell you that too.
03

Stay confident as life changes

After your baseline, Vively continues as ongoing guidance — helping you stay on track, adjust when something changes, and re-test every 3 months to see progress over time.
Get your health baseline
What's included

All of this, for only $99/month

Everything below is included from day one. Cancel anytime.

Practitioner support

  • Test reviews and guidance from a registered nurse trained in optimal health
  • Dietitian support for nutrition and lifestyle changes
  • Plan updates whenever your results change

Ongoing monitoring

  • A full Baseline available every 3 months
  • See every marker trend over time
  • Programs matched to your results

All-in-one mobile app

  • Unlimited AI health intelligence
  • Food tracking and wearables integrations
  • Cycle tracking, journal, and insights
  • Member pricing on additional tests

FAQs

Does this include a blood test?
How do I take the blood test in Australia?
What if I just want the Baseline and don't want a membership?
Can't I just ask my GP to order these tests?
What happens after my Baseline?
What if nothing's wrong?
How long does it take?
Are all markers included for every person?
How does the 100% Money Back Guarantee work?
What happens to my data?
How often do I get retested?