Blood Testing

Average Food Score

Your Average Food Score reflects the overall quality of your diet, expressed as a percentage. A higher score (81–100%) indicates nutrient-rich, minimally processed food choices that support energy, balance, and long-term wellbeing.

Tracking this score helps you see how your eating habits influence performance and recovery. Small, consistent improvements in food quality can strengthen metabolism, boost vitality, and support lasting health.

Average Food Score is available in our Continuous Glucose Monitoring program. Order your Vively CGM now for as low as $199.
Book My TestOrder My CGM

What is Avg Food Score?

Avg Food Score is a summarised percentage measure (%) of your habitual diet quality: it combines data about your intake of key nutrients, whole foods vs processed foods, fibre, diversity and balance, and expresses it on a 0–100 % scale.

Why does it matter for long-term health and wellbeing?

Your diet drives the fuel, building blocks and repair signals your body receives. A stronger Avg Food Score indicates better nutrient sufficiency, favourable metabolic signalling, lower nutritional stress, and greater capacity for sustained energy, recovery and adaptation over years.

What’s an optimal level of Avg Food Score?

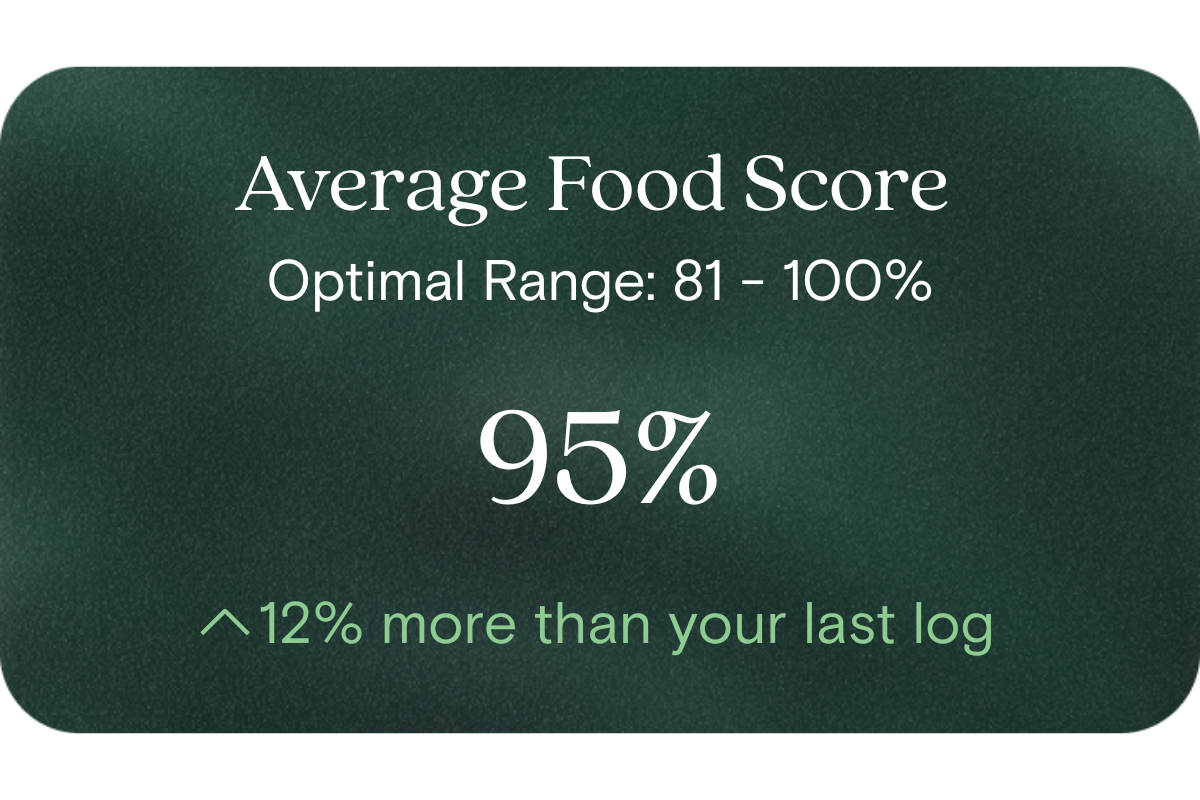
Optimal (healthy target): ~ 81–100 %

Typical lab reference ranges, expressed in Australian units (%):

  • 20 % = 0–20 %
  • 40 % = 21–40 %
  • 60 % = 41–60 %
  • 80 % = 61–80 %
  • 100 % = 81–100 %

Thus, being in the 80–100 % zone (i.e. 81–100 %) is considered optimal for health and wellbeing in our model.

What influences Avg Food Score levels?

Factors include: dietary composition (plants, whole grains, lean proteins, healthy fats), fibre and phytochemical intake, proportion of ultra-processed foods, nutrient density, meal diversity and balance, consistency of good choices, and seasonal or lifestyle variations (e.g. travel, social eating).

What does it mean if Avg Food Score is outside the optimal range?

  • Below ~80 %: you have room to improve — it suggests gaps or imbalances in nutrient intake, over-reliance on processed foods, or insufficient variety.
  • Far below (e.g. < 60 %): this signals greater opportunity for positive shifts — you may see more benefit from targeted dietary refinement, and your metabolism or energy balance may respond more when adjusting.

Importantly, being outside optimal does not imply illness; it simply highlights an opportunity for beneficial change.

How can I support healthy Avg Food Score levels?

  • Emphasise whole, minimally processed foods (vegetables, legumes, whole grains, nuts, seeds)
  • Limit ultra-processed products and refined sugars
  • Increase dietary variety across food groups and colours
  • Prioritise fibre, micronutrient-dense foods, and balanced macros
  • Plan meals, reduce food monotony, and use feedback cycles (track, adjust, test again)
  • Stay consistent: even small positive shifts sustained over time raise your average

This information is provided for general health and wellness purposes only and does not replace medical advice.

References

  1. Liang, S., et al. (2022). Biomarkers of dietary patterns: a systematic review. PMC.
  2. McNamara, A. E., et al. (2021). The Potential of Multi-Biomarker Panels in Nutrition Research. Frontiers in Nutrition.
  3. Abar, L., Steele, E. M., Lee, S. K., et al. (2025). Identification and Validation of Poly-Metabolite Scores for Diets High in Ultra-Processed Food. PLOS Medicine
Comprehensive test

Discover 50+ biomarkers
that shape your health

Take the test
Biological Age
1 marker

Biological age

A reflection of how your body is aging at the cellular level, linked to age risks and longevity.
Red Blood Cell (RBC) Count
Haemoglobin
Haematocrit
Mean Cell Volume (MCV)
Mean Cell Haemoglobin (MCH)
Mean Cell Haemoglobin Concentration (MCHC)
Red Cell Distribution Width (RDW)
Platelet Count
8 markers

Blood health

Key blood indicators like hemoglobin, inflammation, and oxygen transport for overall health.
Cholesterol Ratio
HDL Cholesterol
LDL Cholesterol
Non-HDL Cholesterol
Total Cholesterol
Triglycerides
6 markers

Heart health

Assesses cardiovascular health through cholesterol, lipids, and heart-related risk markers.
Cortisol
Dehydroepiandrosterone Sulfate (DHEA-S)
Free Thyroxine (T4)
Free Triiodothyronine (T3)
Thyroid stimulating hormone (TSH)
5 markers

Hormone balance

Evaluates hormone levels that impact energy, sleep, mood, and metabolism.
White Blood Cell (WBC) Count
Neutrophils
Lymphocytes
Monocytes
Eosinophils
Basophils
6 markers

Immune system

Measures immune activity and inflammatory responses to assess body defenses.
High-Sensitivity C-Reactive Protein (hs-CRP)
1 marker

Inflammation status

Tracks signs of chronic or acute inflammation that may affect long-term disease risk.
Bicarbonate
Chloride
Creatinine
Potassium
Sodium
Urea
Uric acid
Anion Gap
Estimated Glomerular Filtration Rate (EGFR)
9 markers

Kidney function

Assesses kidney health through creatinine and other markers of blood filtration.
Alanine Aminotransferase
Albumin
Alkaline Phosphatase
Aspartate aminotransferase (AST)
Bilirubin
Gamma-glutamyl Transferase (GGT)
Globulin
Total Protein
8 markers

Liver health

Measures liver enzymes and proteins responsible for detoxification and metabolic health.
Fasting Glucose
Fasting Insulin
Haemoglobin A1c (HbA1c) IFCC mmol/m
Haemoglobin A1c (HbA1c) NGSP/DCCT %
HOMA-IR score
5 markers

Metabolic health

Evaluates energy processing with glucose, HbA1c, insulin, and related biomarkers.
Magnesium
1 marker

Vitamins & minerals

Analyzes essential nutrients that support immunity, energy, and overall wellbeing.
Creatine Kinase
1 marker

Muscle strength

Assesses biomarkers related to muscle performance, function, and recovery.
Biological Age
1 marker

Biological age

A reflection of how your body is aging at the cellular level, linked to age risks and longevity.
How it works

Get a clearer picture of your health and weight

01

Schedule your test

Visit one of 4,000 collection centres across Australia at your earliest convenience and take one blood draw
02

Get your results

Review your 50+ biomarkers in the Vively app and get a full breakdown, including your Biological Age and Speed of Ageing.
03

Take control of your health

Track and improve your health through the app, with expert 1:1 support available with dietitian coaches to guide healthy changes
FAQ

Got Questions? We’ve Got Answers

What's included in the blood test?
How is this different from getting a blood test at my GP?
What is the Vively membership?
Why do you test these specific biomarkers?
What happens to my data?