Average glucose: What Low, High and Optimal Average glucose Levels Mean.
Average glucose represents the mean of all your glucose readings over time, measured in mmol/L. It reflects your body’s overall glucose exposure and how consistently it maintains stable energy levels.
A lower, steady average supports efficient metabolism and sustained energy. Tracking this biomarker helps you see how your lifestyle affects glucose balance, allowing early adjustments for long-term wellbeing and performance.
Average Glucose is measured in the Vively app. Join Vively to start tracking.
Average glucose is the mean value of all glucose readings recorded (for example via a Continuous Glucose Monitor, or CGM) over a period. It summarises your day-to-day, night and daily swings into a single figure, offering a snapshot of your typical glycaemic exposure.
Why does it matter for long-term health and wellbeing?
Because it reflects your cumulative glucose exposure rather than isolated spikes or dips, it gives you a more holistic view of metabolic load. It helps you see whether your body is generally operating in a stable glucose environment, which supports better energy levels, efficient metabolism and long-term resilience.
What’s an optimal level of Average glucose?
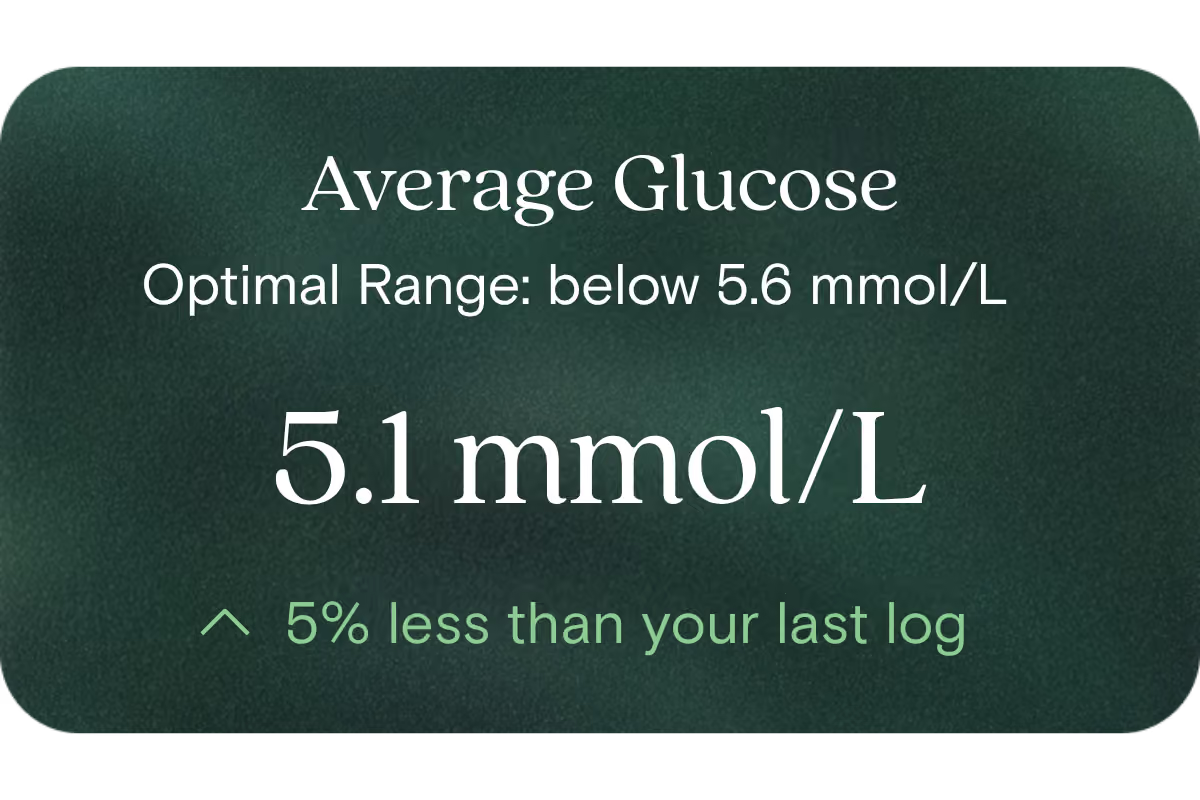
At Vively, we consider 100 % = below 5.6 mmol/L as our optimal target. Here’s how that maps to a typical Australian lab-style reference scale:
If your average glucose is above the “100 %” threshold, it means there's room to improve toward a safer, steadier metabolic baseline.
Physical activity and how well your muscles use glucose
Stress, hormones (e.g. cortisol) and circadian rhythm
Variability (i.e. big swings between high and low)
Because average glucose is a composite, frequent excursions (both up and down) can skew it even if the “average” looks reasonable.
What does it mean if Average glucose is outside the optimal range?
If your average glucose is above 5.6 mmol/L (i.e. less than 100 % on our scale), it suggests you may be spending meaningful time in higher glucose states. That can mean your metabolism is under pressure, potentially limiting your energy stability, recovery, cognitive clarity or metabolic flexibility. It signals an opportunity to adjust habits now, rather than waiting for issues to manifest.
How can I support healthy Average glucose levels?
You can optimise your average glucose through lifestyle strategies, such as:
Moderate and well-distributed carbohydrate intake (balanced with protein, fibre, healthy fats)
Regular movement or exercise, especially after meals
Prioritising sleep and stabilising overnight metabolism
Managing stress and supporting circadian rhythm
Watching for and reducing glycaemic variability (i.e. avoiding big spikes and deep dips)
Iterative adjustments based on your trends, rather than one-off fixes
This information is provided for general health and wellness purposes only and does not replace medical advice.
References
Battelino, T., Danne, T., Bergenstal, R. M., et al. (2019). Clinical targets for continuous glucose monitoring data interpretation: recommendations from the International Consensus on Time in Range. Diabetes Care, 42(8), 1593–1603.
American Diabetes Association / Diabetes journals (GMI concept) – The Glucose Management Indicator: Time to Change Course? (2024)
Australian Prescriber. (2023). Blood glucose monitoring devices: current considerations.
Ready to understand your
Average glucose
in context?
Vively's Baseline Health Check reviews
Average glucose
alongside iron studies, full blood count, inflammation, liver health, metabolic markers and 70+ other biomarkers, then turns your results into a personalised plan. Start My Baseline Health Check
70+ biomarkers analysed, each one tells you something specific about how your body is functioning right now, not just whether you're "sick" or "not sick"
Understand markers linked to healthy aging
A reflection of how your body is aging at the cellular level, linked to age risks and longevity.
Biological Age
Speed of Aging
Understand how your body regulates energy
Review glucose, insulin and lipid markers associated with metabolic balance.
Fasting Glucose
Fasting Insulin
Haemoglobin A1c (HbA1c) IFCC mmol/m
Haemoglobin A1c (HbA1c) NGSP/DCCT %
HOMA-IR
TyG index
AST/ALT Ratio
ALT/TG Ratio
Sodium/Potassium Ratio
hs-CRP / HDL Ratio
See how your blood supports oxygen and energy
Key blood indicators like hemoglobin, inflammation, and oxygen transport for overall health.
Mean Cell Volume (MCV)
Mean Platelet Volume (MPV)
Red Blood Cell (RBC) Count
Haemoglobin
Haematocrit
Red cell distribution width (RDW)
Mean Cell Haemoglobin (MCH)
Mean Cell Haemoglobin Concentration (MCHC)
Platelet count
Review advanced cardiovascular risk markers
Analyse lipid balance and related markers linked to long-term heart and vascular wellbeing.
Your GP isn't the problem. The current health system isn't built for optimal health.
Vively
Standard GP check
Markers analysed
70+ markers
10-15 markers
Optimal ranges included
Biological age
Results reviewed with on-demand practitioner support
Personalised plan built around your results
Ongoing retesting and health trends reporting
How it works
Just 3 simple steps to get started
If needed, we'll recommend further testing to investigate potential issues based on your results
01
Take the test
One simple test to understand where your health stands. Visit one of 4,000 collection centres across Australia at your earliest convenience and take one easy blood draw.
02
Review your results
Meet with a registered health professional to identify what looks fine, what’s worth watching, and what (if anything) needs attention. If nothing needs changing, we’ll tell you that too.
03
Stay confident as life changes
After your baseline, Vively continues as ongoing guidance — helping you stay on track, adjust when something changes, and re-test every 3 months to see progress over time.
Vively is a general wellness platform and does not provide medical advice, diagnosis, or treatment. Any information, insights or guidance offered through our app, website, programs, or coaches is for educational and informational purposes only and should not be considered a substitute for professional medical advice or care. Always consult a qualified healthcare provider before making any health-related decisions.
We acknowledge the Traditional Custodians of the lands where we live and work, the Gadigal of the Eora Nation. We pay our respects to their Elders past and present.























.avif)


.svg)