Blood Testing

Total Cholesterol / HDL Ratio

The Total Cholesterol to HDL Ratio shows how well your body maintains cholesterol balance. It’s calculated by dividing total cholesterol (mmol/L) by HDL cholesterol (mmol/L). Lower ratios mean healthier lipid metabolism, with HDL efficiently clearing excess cholesterol. In Australia, values below 5.6 are normal, and below 3.5 are optimal for long-term cardiovascular and metabolic health.

Tracking this ratio helps you see how lifestyle factors like diet, movement, and stress influence fat metabolism. Maintaining an optimal ratio supports healthy circulation, energy, and overall vitality.

Total Cholesterol / HDL Ratio is available in Vively's Metabolic Essentials Test. Book your blood test now for only $199 per test.
Book My TestOrder My CGM

What is Total Cholesterol / HDL Ratio?

This ratio is simply your measured total cholesterol (in mmol/L) divided by your HDL cholesterol (in mmol/L). It reflects the balance between total cholesterol load and the “good” HDL cholesterol that helps clear cholesterol from tissues.

Why does it matter for long-term health and wellbeing?

While total cholesterol and HDL each carry information, the ratio gives context: how well your HDL function is keeping up with cholesterol burden. A more favourable (lower) ratio suggests your body’s cholesterol-removal pathways are more efficient. Over time, an unfavourable (higher) ratio can indicate progressive imbalance that may erode vascular, metabolic and energetic resilience—even before symptoms arise.

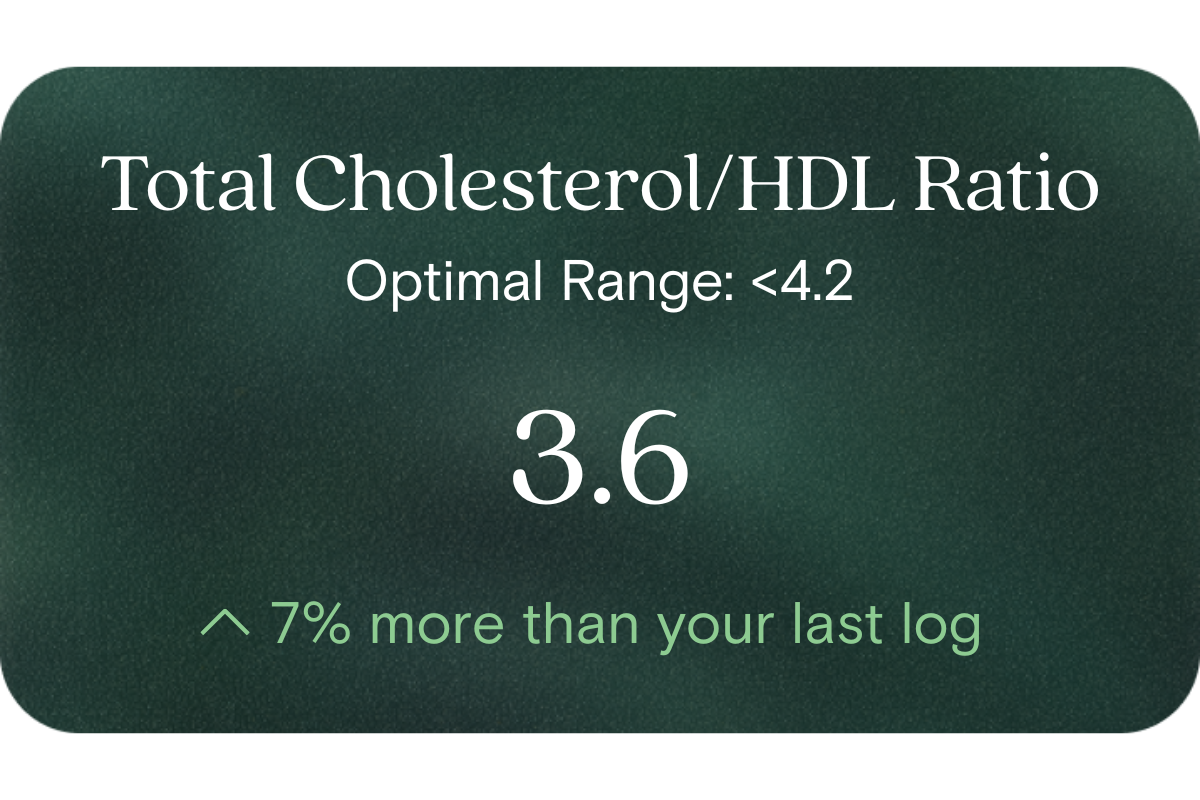
What’s an optimal level?

  • Reference (lab) upper bound: < 5.6 (i.e. a ratio below 5.6 is generally acceptable)
  • Optimal (target) range: < 3.5. In other words, while many labs accept up to 5.6, aiming under 3.5 offers a healthier margin of balance.

What influences Total/HDL Ratio levels?

Factors include:

  • How much LDL, VLDL or remnant cholesterol you carry (raising the numerator)
  • HDL levels and functionality (affecting the denominator)
  • Diet (saturated fat, refined carbs, fibre)
  • Physical activity, especially aerobic and resistance training
  • Weight status and body composition, particularly abdominal fat
  • Genetics and inherited lipid traits
  • Sleep, stress, alcohol, and systemic inflammation

What does it mean if the ratio is outside the optimal range?

If your ratio is higher than optimal, it suggests that either your total cholesterol burden is relatively high, or your HDL is relatively low (or both). This signals an imbalance in lipid transport that, over time, might undermine your vascular and metabolic efficiency. It doesn’t by itself mean disease—but it’s a prompt to investigate contributing lifestyle inputs and course-correct before larger shifts occur.

How can I support healthy Total/HDL Ratio levels?

  • Prioritise whole-food dietary patterns: plenty of vegetables, legumes, whole grains, nuts, seeds; moderate healthy fats (e.g. olive oil, fatty fish) and reduce saturated/trans fats
  • Ensure regular aerobic exercise plus strength training
  • Maintain or improve healthy body composition (especially reducing central fat)
  • Focus on good sleep, stress management and recovery
  • Avoid smoking, limit excessive alcohol
  • Use targeted nutritional support (e.g. soluble fibre, plant sterols) as appropriate
  • Monitor regularly and adjust in a data-informed way

This information is provided for general health and wellness purposes only and does not replace medical advice.

References

  1. Australian Institute of Health and Welfare. Heart, stroke and vascular disease: Australian facts (2024).
  2. CSIRO. Cholesterol Facts (Australia) – roles of HDL in lipid balance.
  3. Calling, S., et al. (2019). The ratio of total cholesterol to HDL-cholesterol as a predictor of acute myocardial infarction in middle-aged women. BMC Cardiovascular Disorders.
  4. Kinosian, B., et al. (1994). Cholesterol and coronary heart disease: predicting risks by the total cholesterol/HDL ratio. American Journal of Cardiology.

Comprehensive test

Discover 50+ biomarkers
that shape your health

Take the test
Biological Age
1 marker

Biological age

A reflection of how your body is aging at the cellular level, linked to age risks and longevity.
Red Blood Cell (RBC) Count
Haemoglobin
Haematocrit
Mean Cell Volume (MCV)
Mean Cell Haemoglobin (MCH)
Mean Cell Haemoglobin Concentration (MCHC)
Red Cell Distribution Width (RDW)
Platelet Count
8 markers

Blood health

Key blood indicators like hemoglobin, inflammation, and oxygen transport for overall health.
Cholesterol Ratio
HDL Cholesterol
LDL Cholesterol
Non-HDL Cholesterol
Total Cholesterol
Triglycerides
6 markers

Heart health

Assesses cardiovascular health through cholesterol, lipids, and heart-related risk markers.
Cortisol
Dehydroepiandrosterone Sulfate (DHEA-S)
Free Thyroxine (T4)
Free Triiodothyronine (T3)
Thyroid stimulating hormone (TSH)
5 markers

Hormone balance

Evaluates hormone levels that impact energy, sleep, mood, and metabolism.
White Blood Cell (WBC) Count
Neutrophils
Lymphocytes
Monocytes
Eosinophils
Basophils
6 markers

Immune system

Measures immune activity and inflammatory responses to assess body defenses.
High-Sensitivity C-Reactive Protein (hs-CRP)
1 marker

Inflammation status

Tracks signs of chronic or acute inflammation that may affect long-term disease risk.
Bicarbonate
Chloride
Creatinine
Potassium
Sodium
Urea
Uric acid
Anion Gap
Estimated Glomerular Filtration Rate (EGFR)
9 markers

Kidney function

Assesses kidney health through creatinine and other markers of blood filtration.
Alanine Aminotransferase
Albumin
Alkaline Phosphatase
Aspartate aminotransferase (AST)
Bilirubin
Gamma-glutamyl Transferase (GGT)
Globulin
Total Protein
8 markers

Liver health

Measures liver enzymes and proteins responsible for detoxification and metabolic health.
Fasting Glucose
Fasting Insulin
Haemoglobin A1c (HbA1c) IFCC mmol/m
Haemoglobin A1c (HbA1c) NGSP/DCCT %
HOMA-IR score
5 markers

Metabolic health

Evaluates energy processing with glucose, HbA1c, insulin, and related biomarkers.
Magnesium
1 marker

Vitamins & minerals

Analyzes essential nutrients that support immunity, energy, and overall wellbeing.
Creatine Kinase
1 marker

Muscle strength

Assesses biomarkers related to muscle performance, function, and recovery.
Biological Age
1 marker

Biological age

A reflection of how your body is aging at the cellular level, linked to age risks and longevity.
How it works

Get a clearer picture of your health and weight

01

Schedule your test

Visit one of 4,000 collection centres across Australia at your earliest convenience and take one blood draw
02

Get your results

Review your 50+ biomarkers in the Vively app and get a full breakdown, including your Biological Age and Speed of Ageing.
03

Take control of your health

Track and improve your health through the app, with expert 1:1 support available with dietitian coaches to guide healthy changes
FAQ

Got Questions? We’ve Got Answers

What's included in the blood test?
How is this different from getting a blood test at my GP?
What is the Vively membership?
Why do you test these specific biomarkers?
What happens to my data?