All Tests
/
Blood Testing
/
Chromium
★★★★★
Trusted by 30,000+ Australians
Blood Testing

Chromium Blood Test: What Low, High and Optimal Chromium Levels Mean.

Chromium is a trace mineral measured as part of a micronutrient or metabolic panel to assess glucose and insulin-related metabolism. Chromium supports insulin action and helps cells use glucose efficiently for energy. Low Chromium levels may be associated with impaired insulin sensitivity, insulin resistance, unstable blood sugar, fatigue, or increased carbohydrate cravings, while high levels are uncommon and most often reflect supplementation rather than improved metabolic function. This matters because inefficient glucose handling can affect energy levels, appetite regulation, and long-term metabolic and cardiovascular health. A Chromium blood test is best interpreted alongside fasting glucose, insulin, HbA1c, and lipid markers to understand underlying metabolic drivers and insulin function.

Vively's health team can help you test Chromium. Start with Vively's Baseline Health Check first - only $99 today.
Dr Michelle Woolhouse
July 1, 2026
Book My Test
Book My Test
Same-day pathology referral | 4,000+ Testing Locations in AU | Results in 2-3 days
Order My CGM

What is chromium?

Chromium is a trace mineral—a micronutrient that the body requires in very small amounts. It is naturally present in some foods and is absorbed in small quantities. In the body, chromium (in its biologically active form) is believed to enhance the action of insulin, thereby supporting normal carbohydrate, fat and protein metabolism.

Why does chromium matter for long-term health and wellbeing?

Chromium supports the body’s metabolic function by potentially improving insulin sensitivity,  meaning the body’s cells respond more effectively to insulin’s signal, enabling efficient glucose uptake and stable energy supply.

For someone focused on prevention, performance and metabolic resilience, maintaining healthy chromium levels may support stable energy, reduce sugar cravings, and aid overall nutrient utilisation.

What's a typical lab (reference) range for chromium?

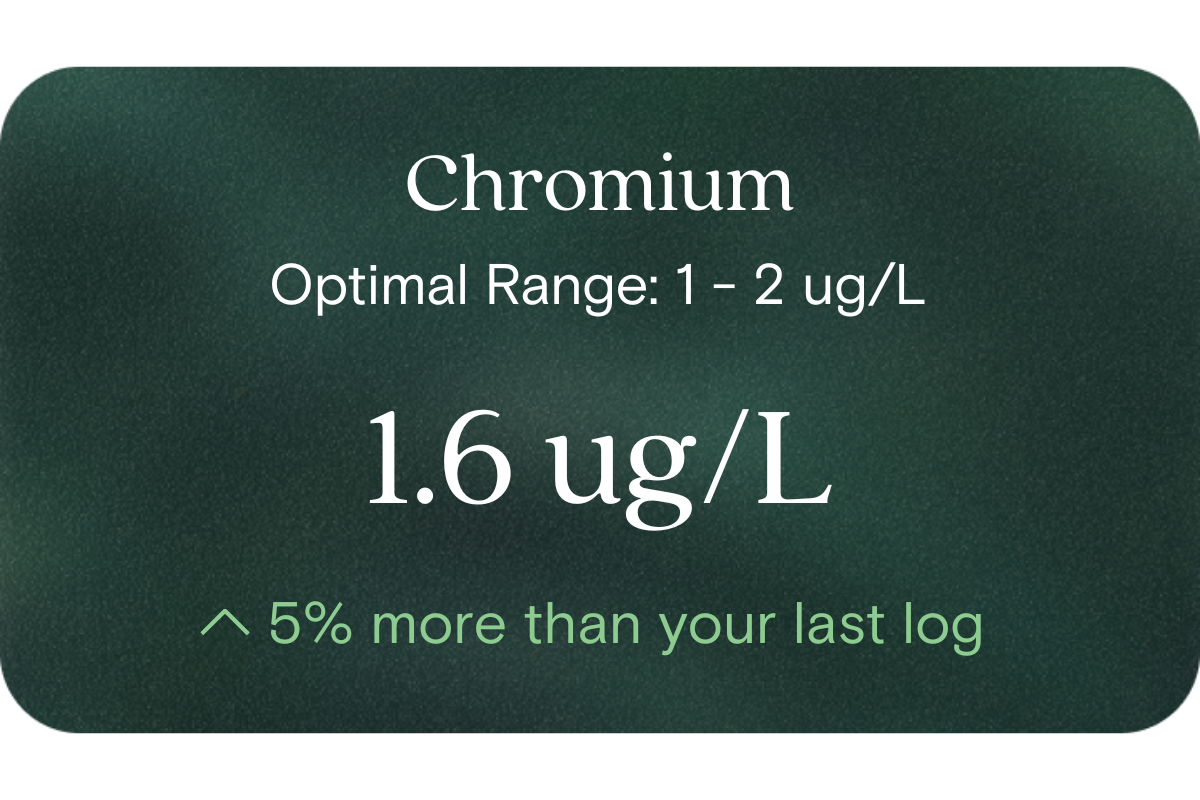
  • Reference range: 1 µg/L to 2 µg/L (Australian units).
  • (At this time, we do not have a well-established “optimal” range beyond the standard reference — but staying within the 1-2 µg/L band is taken as normal.)

What influences chromium levels?

Chromium levels can be influenced by dietary intake (foods containing chromium), overall absorption efficiency, and individual metabolic factors. The bioavailability of chromium from food is relatively low, and absorption may vary depending on diet and other nutrients.

What does it mean if chromium is below or above the reference range?

  • If chromium is low (below ~1 µg/L): it might indicate that your dietary intake or absorption of this micronutrient is insufficient — which could reduce the body’s metabolic flexibility and efficiency over time.
  • If chromium is high (above ~2 µg/L): because chromium’s role and optimal level are not firmly established, elevated values do not automatically equate to better metabolic health—and there is limited evidence that higher-than-normal chromium delivers additional benefit. Indeed, some research suggests that, in healthy individuals, supplementation may not enhance insulin sensitivity.

How can I support healthy chromium levels?

Focus on a balanced, micronutrient-rich diet that includes a variety of whole foods, especially those known to naturally contain trace minerals. Because chromium absorption from food can be modest, eating a diverse diet ensures a better chance of obtaining a full spectrum of trace nutrients.

Also consider regular measurement: by tracking chromium (alongside other metabolic biomarkers) over time, you can detect subtle shifts and adapt diet or lifestyle early to maintain metabolic health.

This information is provided for general health and wellness purposes only and does not replace medical advice.

References

  1. Anderson, R. A. (2008). Chromium and insulin resistance: a review. The Journal of Nutrition.
  2. Wang Z-Q. et al. (2006). Chromium picolinate enhances insulin signalling in skeletal muscle. Journal of Biological Chemistry.
  3. NIH Office of Dietary Supplements. Chromium – Health Professional Fact Sheet (2022).

Ready to understand your [marker name] in context?  

Vively's Baseline Health Check reviews [marker name] alongside iron studies, full blood count, inflammation, liver health, metabolic markers and 70+ other biomarkers, then turns your results into a personalised plan.  Start My Baseline Health Check

What we measure

 70+ biomarkers analysed, each one tells you something specific about how your body is functioning right now, not just whether you're "sick" or "not sick"

Understand markers linked to healthy aging

A reflection of how your body is aging at the cellular level, linked to age risks and longevity.

  • Biological Age
  • Speed of Aging

Understand how your body regulates energy

Review glucose, insulin and lipid markers associated with metabolic balance.

  • Fasting Glucose
  • Fasting Insulin
  • Haemoglobin A1c (HbA1c) IFCC mmol/m
  • Haemoglobin A1c (HbA1c) NGSP/DCCT %
  • HOMA-IR
  • Uric Acid/HDL-C (UHR)
  • TyG index
  • Sodium/Potassium Ratio
  • hs-CRP / HDL Ratio

See how your blood supports oxygen and energy

Key blood indicators like hemoglobin, inflammation, and oxygen transport for overall health.

  • Mean Cell Volume (MCV)
  • Red Blood Cell (RBC) Count
  • Haemoglobin
  • Haematocrit
  • Red cell distribution width (RDW)
  • Mean Cell Haemoglobin (MCH)
  • Mean Cell Haemoglobin Concentration (MCHC)
  • Platelet count

Review advanced cardiovascular risk markers

Analyse lipid balance and related markers linked to long-term heart and vascular wellbeing.

  • Total Cholesterol
  • LDL Cholesterol
  • HDL Cholesterol
  • Non-HDL Cholesterol
  • Cholesterol Ratio
  • Triglycerides
  • Cholesterol/HDL Ratio
  • Total Cholesterol/HDL Ratio
  • LDL/HDL Ratio
  • Triglyceride/HDL Cholesterol (Molar Ratio)
  • Non-HDL Cholesterol/Total Cholesterol (Mass Ratio)
  • Atherogenic Index of Plasma (AIP)

See how your immune system is functioning

Review white blood cell markers that reflect immune activity and response.

  • White Blood Cell (WBC) Count
  • Neutrophils
  • Lymphocytes
  • Eosinophils
  • Basophils
  • Neutrophil-to-Lymphocyte Ratio
  • Neutrophil-to-HDL Cholesterol Ratio (NHR)
  • Platelet/Lymphocyte Ratio
  • Monocytes

Identify markers linked to systemic inflammation

Assess signals associated with inflammatory balance and overall physiological stress.

  • High-Sensitivity C-Reactive Protein (hs-CRP)
  • CRP/Albumin Ratio (CAR)
  • Systemic Inflammation Index (SII)

Monitor markers related to kidney function

Review indicators that reflect how efficiently your kidneys filter and regulate fluids.

  • Chloride
  • Bicarbonate
  • Sodium
  • Potassium
  • Urea
  • Creatinine
  • BUN/Creatinine Ratio
  • Estimated Glomerular Filtration Rate (eGFR)
  • Anion Gap

Assess markers connected to liver health

Understand enzymes and related markers linked to metabolic processing and detoxification pathways.

  • Alkaline Phosphatase
  • Bilirubin
  • Aspartate aminotransferase (AST)
  • Gamma-glutamyl Transferase (GGT)
  • Alanine Aminotransferase (ALT)
  • Globulin
  • Total Protein
  • NAFLD FIB-4
  • Albumin/Globulin Ratio
  • Albumin

Check your thyroid function

Helps identify thyroid issues linked to energy, mood and weight.

  • Thyroid Stimulating Hormone (TSH)

Check key nutrient levels that support daily function

Assess essential vitamins and minerals linked to energy production, recovery and overall wellbeing.

  • Iron
  • Phosphate
  • Magnesium
  • Transferrin
  • Ferritin
  • Transferrin saturation
  • TIBC
  • Vitamin D
Get my baseline for $99
Why us?

What a standard check often leaves out

Your GP isn't the problem. The current health system isn't built for optimal health.

Vively
Standard GP check
Markers analysed
70+ markers
10-15 markers
Optimal ranges included
Biological age
Results reviewed with on-demand practitioner support
Personalised plan built around your results
Ongoing retesting and health trends reporting
How it works

Just 3 simple steps to get started

If needed, we'll recommend further testing to investigate potential issues based on your results

01

Take the test

One simple test to understand where your health stands. Visit one of 4,000 collection centres across Australia at your earliest convenience and take one easy blood draw.
02

Review your results

Meet with a registered health professional to identify what looks fine, what’s worth watching, and what (if anything) needs attention. If nothing needs changing, we’ll tell you that too.
03

Stay confident as life changes

After your baseline, Vively continues as ongoing guidance — helping you stay on track, adjust when something changes, and re-test every 3 months to see progress over time.
Get your health baseline
What's included

All of this, for only $99/month

Everything below is included from day one. Cancel anytime.

Practitioner support

  • Test reviews and guidance from a registered nurse trained in optimal health
  • Dietitian support for nutrition and lifestyle changes
  • Plan updates whenever your results change

Ongoing monitoring

  • A full Baseline available every 3 months
  • See every marker trend over time
  • Programs matched to your results

All-in-one mobile app

  • Unlimited AI health intelligence
  • Food tracking and wearables integrations
  • Cycle tracking, journal, and insights
  • Member pricing on additional tests

FAQs

Does this include a blood test?
How do I take the blood test in Australia?
What if I just want the Baseline and don't want a membership?
Can't I just ask my GP to order these tests?
What happens after my Baseline?
What if nothing's wrong?
How long does it take?
Are all markers included for every person?
How does the 100% Money Back Guarantee work?
What happens to my data?
How often do I get retested?