Measurements

Average Food Quality

Avg Food Quality (%) reflects the nutritional value of your diet, with higher scores indicating regular intake of whole, nutrient-rich foods and lower scores suggesting more processed options. It aligns with Australian Dietary Guidelines and tools like the CSIRO Healthy Diet Score.

Tracking this metric helps you see how your food choices support energy, metabolism, and overall wellbeing. Maintaining a higher score encourages better nutrient balance and long-term vitality.

Average Food Quality is available in our Continuous Glucose Monitoring program. Order your Vively CGM now for as low as $199.
Book My TestOrder My CGM

What is Avg Food Quality?

Avg Food Quality measures the nutritional value of the foods you log in your diet. It reflects how well your eating habits align with high-quality nutrition — favouring whole, nutrient-dense foods over processed or refined options.

Why does it matter for long-term health and wellbeing?

Maintaining a high Avg Food Quality supports balanced energy, nutrient sufficiency, and healthy metabolic function. Studies consistently show that higher diet quality is linked to improved overall wellbeing, reduced inflammation, and better physical performance. Tracking this biomarker gives insight into how your daily food choices influence your long-term vitality.

What’s an optimal level of Avg Food Quality?

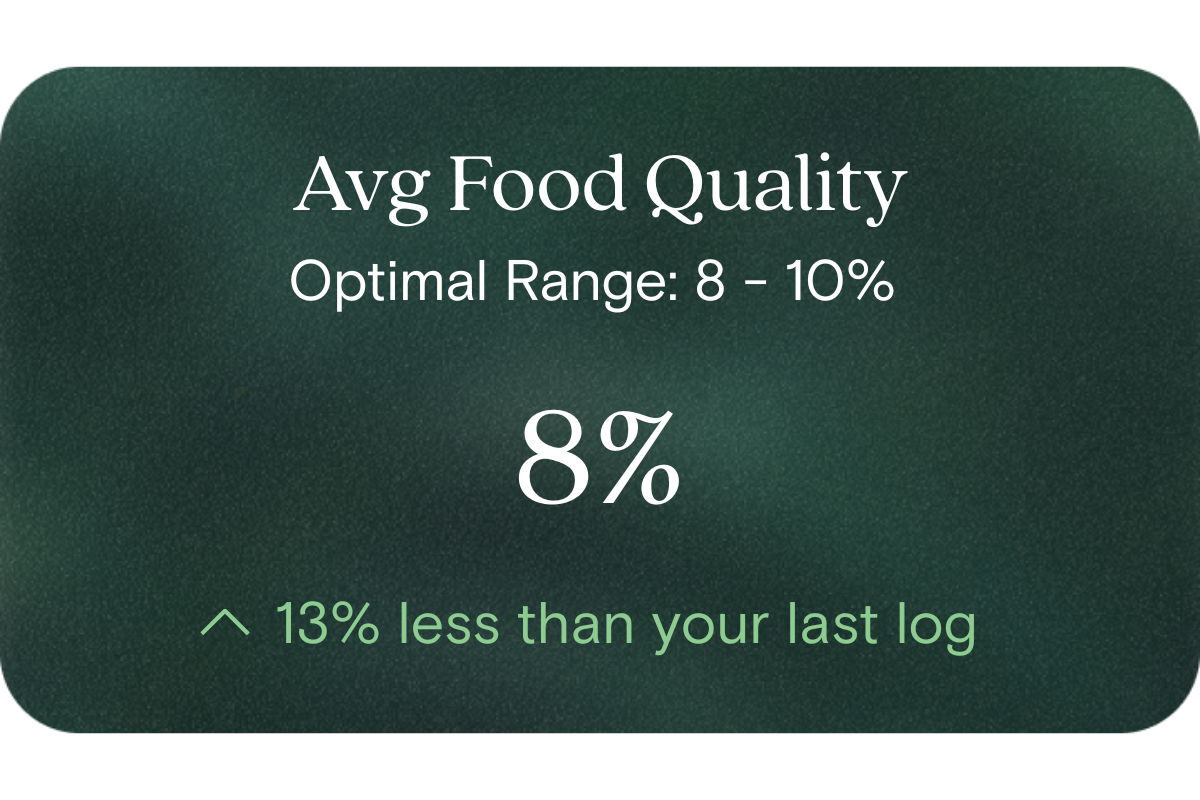
  • Optimal: 100% (average 9–10)
  • Very good: 80% (average 8–9)
  • Good: 60% (average 6.5–8)
  • Sub-optimal: 40% (average 5–6.5)
  • Pay attention: 20% (average 5)

These ranges are based on validated dietary quality frameworks used in Australian nutrition research and provide a practical guide for lifestyle improvement.

What influences Avg Food Quality levels?

  • The proportion of whole vs processed foods in your diet
  • Intake of fruits, vegetables, legumes, and whole grains
  • Frequency of discretionary foods high in added sugars, fats, or sodium
  • Meal planning, variety, and portion sizes
  • Hydration, alcohol intake, and consistency across meals

What does it mean if Avg Food Quality is outside the optimal range?

Scores below 80% suggest your diet may include more processed or nutrient-poor foods than recommended. This doesn’t mean poor health — it simply signals an opportunity to improve balance and variety. Adjusting portion sizes, adding colourful produce, and reducing packaged foods can help lift your score over time.

How can I support healthy Avg Food Quality levels?

  • Choose whole, unprocessed foods most of the time
  • Increase daily servings of vegetables, fruits, and legumes
  • Swap sugary or refined snacks for nuts, seeds, or yoghurt
  • Prepare meals at home to have more control over ingredients
  • Track your food choices regularly to stay aware of your progress

This information is provided for general health and wellness purposes only and does not replace medical advice.

References

  1. Collins, C. E., Burrows, T. L., Rollo, M. E., Boggess, M. M., Watson, J. F., Guest, M., Duncanson, K., Pezdirc, K., & Hutchesson, M. J. (2015). The Comparative Validity and Reproducibility of a Diet Quality Index for Adults: The Australian Recommended Food Score. Nutrients, 7(2), 785-798.
  2. Hendrie, G. A., Baird, D., Golley, R. K., & Noakes, M. (2017). The CSIRO Healthy Diet Score: An Online Survey to Estimate Compliance with the Australian Dietary Guidelines. Nutrients, 9(1), 47.
  3. Hendrie, G. A., Baird, D., Golley, R. K. (2021). Understanding variation in the CSIRO Healthy Diet Score and diet quality measurement. International Journal of Environmental Research and Public Health, 18(2), 378.
  4. Ashton, L., Williams, R., Wood, L., Schumacher, T., Burrows, T., Rollo, M., Pezdirc, K., Callister, R., & Collins, C. (2017). Comparison of Australian Recommended Food Score and Plasma Carotenoid Concentrations: A Validation Study in Adults. Nutrients, 9(8), 888.
Comprehensive test

Discover 50+ biomarkers
that shape your health

Take the test
Biological Age
1 marker

Biological age

A reflection of how your body is aging at the cellular level, linked to age risks and longevity.
Red Blood Cell (RBC) Count
Haemoglobin
Haematocrit
Mean Cell Volume (MCV)
Mean Cell Haemoglobin (MCH)
Mean Cell Haemoglobin Concentration (MCHC)
Red Cell Distribution Width (RDW)
Platelet Count
8 markers

Blood health

Key blood indicators like hemoglobin, inflammation, and oxygen transport for overall health.
Cholesterol Ratio
HDL Cholesterol
LDL Cholesterol
Non-HDL Cholesterol
Total Cholesterol
Triglycerides
6 markers

Heart health

Assesses cardiovascular health through cholesterol, lipids, and heart-related risk markers.
Cortisol
Dehydroepiandrosterone Sulfate (DHEA-S)
Free Thyroxine (T4)
Free Triiodothyronine (T3)
Thyroid stimulating hormone (TSH)
5 markers

Hormone balance

Evaluates hormone levels that impact energy, sleep, mood, and metabolism.
White Blood Cell (WBC) Count
Neutrophils
Lymphocytes
Monocytes
Eosinophils
Basophils
6 markers

Immune system

Measures immune activity and inflammatory responses to assess body defenses.
High-Sensitivity C-Reactive Protein (hs-CRP)
1 marker

Inflammation status

Tracks signs of chronic or acute inflammation that may affect long-term disease risk.
Bicarbonate
Chloride
Creatinine
Potassium
Sodium
Urea
Uric acid
Anion Gap
Estimated Glomerular Filtration Rate (EGFR)
9 markers

Kidney function

Assesses kidney health through creatinine and other markers of blood filtration.
Alanine Aminotransferase
Albumin
Alkaline Phosphatase
Aspartate aminotransferase (AST)
Bilirubin
Gamma-glutamyl Transferase (GGT)
Globulin
Total Protein
8 markers

Liver health

Measures liver enzymes and proteins responsible for detoxification and metabolic health.
Fasting Glucose
Fasting Insulin
Haemoglobin A1c (HbA1c) IFCC mmol/m
Haemoglobin A1c (HbA1c) NGSP/DCCT %
HOMA-IR score
5 markers

Metabolic health

Evaluates energy processing with glucose, HbA1c, insulin, and related biomarkers.
Magnesium
1 marker

Vitamins & minerals

Analyzes essential nutrients that support immunity, energy, and overall wellbeing.
Creatine Kinase
1 marker

Muscle strength

Assesses biomarkers related to muscle performance, function, and recovery.
Biological Age
1 marker

Biological age

A reflection of how your body is aging at the cellular level, linked to age risks and longevity.
How it works

Get a clearer picture of your health and weight

01

Schedule your test

Visit one of 4,000 collection centres across Australia at your earliest convenience and take one blood draw
02

Get your results

Review your 50+ biomarkers in the Vively app and get a full breakdown, including your Biological Age and Speed of Ageing.
03

Take control of your health

Track and improve your health through the app, with expert 1:1 support available with dietitian coaches to guide healthy changes
FAQ

Got Questions? We’ve Got Answers

What's included in the blood test?
How is this different from getting a blood test at my GP?
What is the Vively membership?
Why do you test these specific biomarkers?
What happens to my data?