All Tests
/
Continuous Glucose Monitoring
/
Glucose Variability
Continuous Glucose Monitoring

Glucose Variability

Glucose variability (GV) measures how much your blood glucose fluctuates through the day, expressed as a percentage. Lower variability reflects steadier energy and better metabolic efficiency, while higher variability means greater swings between highs and lows.

At Vively, an optimal GV is below 9.9%, showing stable glucose control and strong metabolic balance. Tracking this metric helps you see how diet, activity, sleep, and stress affect your daily energy patterns and overall wellbeing.

Glucose Variability is available in our Continuous Glucose Monitoring program. Order your Vively CGM now for as low as $199.
Book My TestOrder My CGM

What is glucose variability?

Glucose variability is the measure of how much your blood glucose levels rise and fall across a given period. It reflects the stability of your energy supply rather than your average glucose level alone, providing a deeper view of how well your metabolism adapts to food, movement, and stress.

Why does it matter for long-term health and wellbeing?

Stable glucose levels help sustain energy, focus, and metabolic balance. Reducing glucose fluctuations may support more consistent energy throughout the day, fewer energy dips, and improved overall metabolic performance — key factors in long-term wellbeing and vitality.

What’s an optimal level of glucose variability?

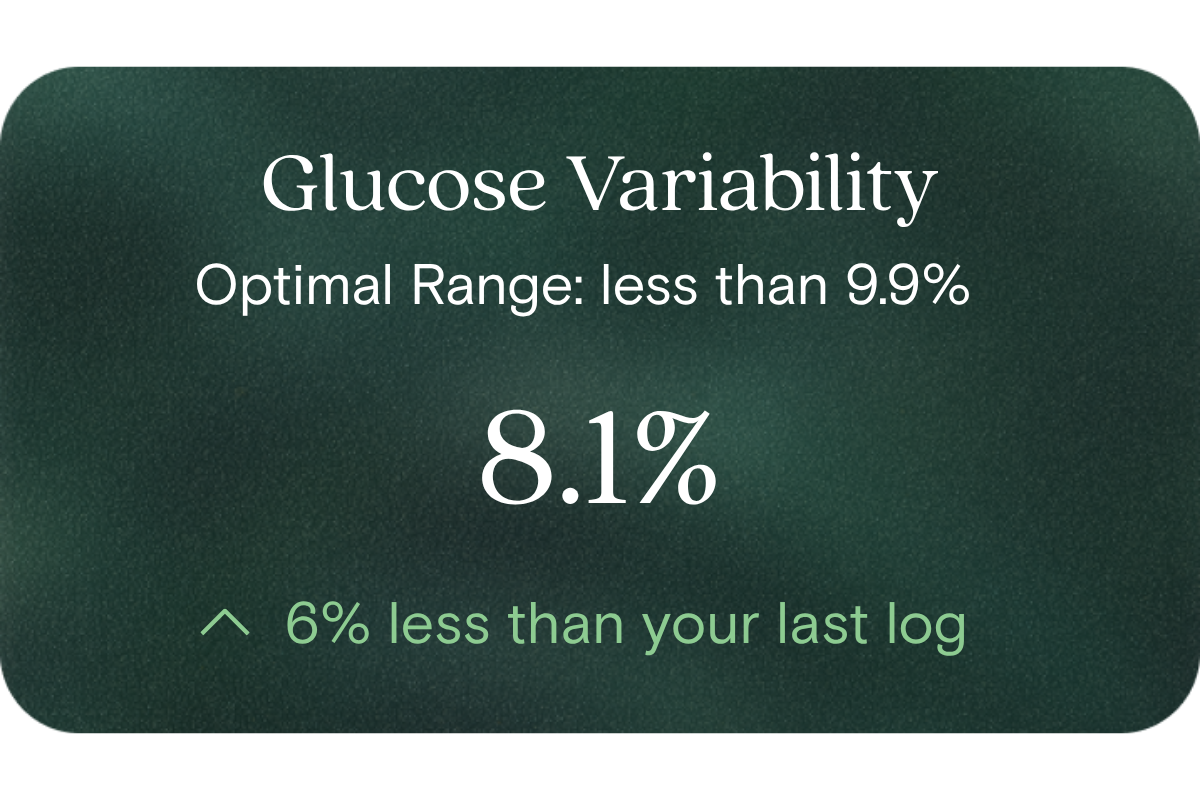
Vively’s optimal range is less than 9.9%, representing tightly regulated glucose stability. 

Typical Australian reference ranges are:

  • 20% = more than 25% (Pay attention)
  • 40% = 20–24.9% (Sub-optimal)
  • 60% = 15–19.9% (Good)
  • 80% = 10–14.9% (Great)
  • 100% = less than 9.9% (Optimal)

What influences glucose variability levels?

Several lifestyle factors can affect GV, including meal composition, portion size, physical activity, sleep quality, and stress management. Processed foods high in refined carbohydrates or irregular eating patterns may increase variability, while balanced meals, regular exercise, and good sleep habits can promote steadier glucose control.

What does it mean if glucose variability is outside the optimal range?

Higher glucose variability may indicate inconsistent energy regulation, often linked to diet quality, stress, or disrupted sleep patterns. While it doesn’t diagnose a condition, it highlights an opportunity to adjust your lifestyle for more stable energy and improved metabolic efficiency.

How can I support healthy glucose variability levels?

You can improve GV by maintaining consistent meal times, prioritising whole foods rich in fibre and protein, staying physically active, managing stress, and ensuring good sleep. Tracking your glucose trends with a CGM helps identify which habits best support stable energy throughout the day.

This information is provided for general health and wellness purposes only and does not replace medical advice.

References

  1. The diaTribe Foundation. (2018, October 10). Understanding average glucose, standard deviation, CV, and blood sugar variability.
  2. Australian Government Department of Health. The Australian Dietary Guidelines. (2013)
  3. Harvard T.H. Chan School of Public Health. Carbohydrates and Blood Sugar. The Nutrition Source.
  4. Australian Institute of Health and Welfare (AIHW). (2023). Australia’s health 2023: lifestyle and risk factors.
Comprehensive test

Discover 50+ biomarkers
that shape your health

Take the test
Biological Age
1 marker

Biological age

A reflection of how your body is aging at the cellular level, linked to age risks and longevity.
Red Blood Cell (RBC) Count
Haemoglobin
Haematocrit
Mean Cell Volume (MCV)
Mean Cell Haemoglobin (MCH)
Mean Cell Haemoglobin Concentration (MCHC)
Red Cell Distribution Width (RDW)
Platelet Count
8 markers

Blood health

Key blood indicators like hemoglobin, inflammation, and oxygen transport for overall health.
Cholesterol Ratio
HDL Cholesterol
LDL Cholesterol
Non-HDL Cholesterol
Total Cholesterol
Triglycerides
6 markers

Heart health

Assesses cardiovascular health through cholesterol, lipids, and heart-related risk markers.
Cortisol
Dehydroepiandrosterone Sulfate (DHEA-S)
Free Thyroxine (T4)
Free Triiodothyronine (T3)
Thyroid stimulating hormone (TSH)
5 markers

Hormone balance

Evaluates hormone levels that impact energy, sleep, mood, and metabolism.
White Blood Cell (WBC) Count
Neutrophils
Lymphocytes
Monocytes
Eosinophils
Basophils
6 markers

Immune system

Measures immune activity and inflammatory responses to assess body defenses.
High-Sensitivity C-Reactive Protein (hs-CRP)
1 marker

Inflammation status

Tracks signs of chronic or acute inflammation that may affect long-term disease risk.
Bicarbonate
Chloride
Creatinine
Potassium
Sodium
Urea
Uric acid
Anion Gap
Estimated Glomerular Filtration Rate (EGFR)
9 markers

Kidney function

Assesses kidney health through creatinine and other markers of blood filtration.
Alanine Aminotransferase
Albumin
Alkaline Phosphatase
Aspartate aminotransferase (AST)
Bilirubin
Gamma-glutamyl Transferase (GGT)
Globulin
Total Protein
8 markers

Liver health

Measures liver enzymes and proteins responsible for detoxification and metabolic health.
Fasting Glucose
Fasting Insulin
Haemoglobin A1c (HbA1c) IFCC mmol/m
Haemoglobin A1c (HbA1c) NGSP/DCCT %
HOMA-IR score
5 markers

Metabolic health

Evaluates energy processing with glucose, HbA1c, insulin, and related biomarkers.
Magnesium
1 marker

Vitamins & minerals

Analyzes essential nutrients that support immunity, energy, and overall wellbeing.
Creatine Kinase
1 marker

Muscle strength

Assesses biomarkers related to muscle performance, function, and recovery.
Biological Age
1 marker

Biological age

A reflection of how your body is aging at the cellular level, linked to age risks and longevity.
How it works

Get a clearer picture of your health and weight

01

Schedule your test

Visit one of 4,000 collection centres across Australia at your earliest convenience and take one blood draw
02

Get your results

Review your 50+ biomarkers in the Vively app and get a full breakdown, including your Biological Age and Speed of Ageing.
03

Take control of your health

Track and improve your health through the app, with expert 1:1 support available with dietitian coaches to guide healthy changes
FAQ

Got Questions? We’ve Got Answers

What's included in the blood test?
How is this different from getting a blood test at my GP?
What is the Vively membership?
Why do you test these specific biomarkers?
What happens to my data?