What is Haemoglobin A1c (HbA1c) NGSP/DCCT %?
Haemoglobin A1c, or HbA1c, measures the percentage of haemoglobin in your red blood cells that has glucose attached to it. Because red blood cells live for around 8 to 12 weeks, this test reflects your average blood sugar over the past two to three months. NGSP/DCCT % is simply the reporting unit used, expressing HbA1c as a percentage rather than in mmol/mol. Most Australian pathology reports show both units side by side.
Unlike fasting glucose, which gives a snapshot in time, HbA1c smooths out daily peaks and troughs and provides a longer-term view of glucose control. That makes it one of the most widely used markers for screening, diagnosing and monitoring diabetes, as well as tracking metabolic health over time. You can read more in our complete guide to the HbA1c blood test.
Why does HbA1c % matter for long-term health and wellbeing?
HbA1c is one of the strongest long-term predictors of metabolic and cardiovascular risk. Chronically elevated levels increase the likelihood of type 2 diabetes and its complications, including cardiovascular disease, kidney disease, nerve damage, eye disease, fatty liver disease and cognitive decline. Even small sustained rises in the pre-diabetes range have been linked with higher risk of heart disease and stroke.
Because it reflects a longer timeframe than fasting glucose, HbA1c helps you see the pattern rather than one-off spikes. Keeping HbA1c in a healthy range supports steady energy, stable mood, better recovery from exercise and healthier ageing. It is one of the core metabolic markers Vively tracks as part of its baseline health testing.
What is an ideal HbA1c % level?
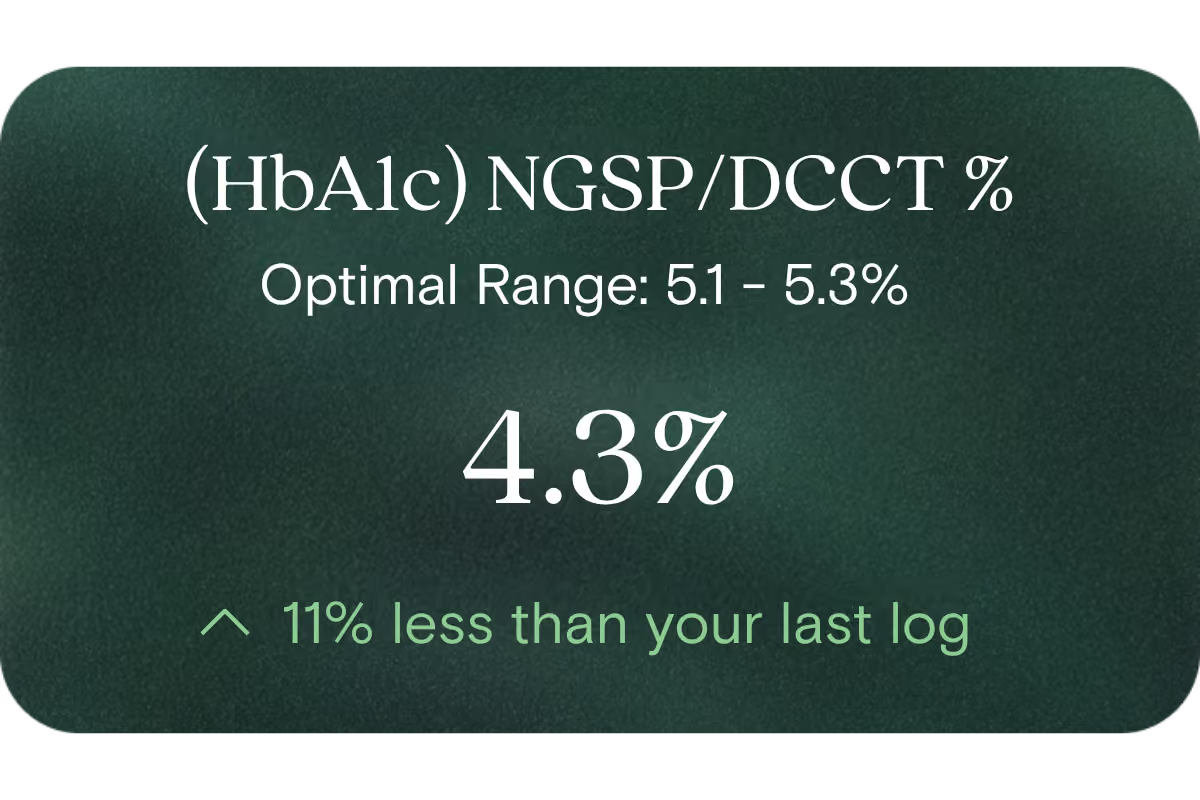
In Australia, HbA1c % is generally interpreted as follows: below 6.0% is considered non-diabetic, 6.0 to 6.4% falls in the pre-diabetes range, and 6.5% or above is used to help diagnose diabetes. Many clinicians consider an optimal, lower-risk range for long-term metabolic health to sit around 5.1 to 5.4%, though this is not an official cut-off.
There is no single perfect number. Interpretation depends on your age, ethnicity, pregnancy status, red blood cell health, medications and other markers such as fasting glucose and fasting insulin. HbA1c targets are also individualised for people who already have diabetes, are older or have other health conditions, so your target should always be discussed with your GP.
What influences HbA1c % levels?
The biggest driver is your average blood glucose over the previous few months, which is shaped by diet quality, meal patterns, portion size, physical activity, body composition, sleep, stress and alcohol. Diets high in refined carbohydrates, sugary drinks and ultra-processed foods tend to push HbA1c up, while regular movement, strength training, quality sleep and stress management help bring it down.
HbA1c is also influenced by factors unrelated to blood sugar. Anything that changes red blood cell lifespan can shift the number, including iron deficiency, vitamin B12 or folate deficiency, haemoglobinopathies such as thalassaemia, recent blood loss, blood transfusion, kidney disease, pregnancy and some medications. This is one reason HbA1c should never be interpreted in isolation.
What are the symptoms of high HbA1c %?
A raised HbA1c often has no obvious symptoms in the early stages, which is why routine testing matters. When symptoms do appear, they can include increased thirst, frequent urination, ongoing fatigue, blurred vision, slow-healing cuts, recurrent infections, unexplained weight change and tingling or numbness in the hands or feet. Some people also notice stubborn weight gain around the middle, sugar cravings and energy dips after meals.
These signs are not diagnostic on their own, but they can be a useful prompt to test. HbA1c is often more meaningful when read alongside real-world glucose responses, which you can explore in our article on continuous glucose monitoring for non-diabetics.
What causes high HbA1c %?
The most common cause is a sustained pattern of higher blood glucose, usually driven by insulin resistance, pre-diabetes or type 2 diabetes. Contributing factors include a diet high in refined carbohydrates and ultra-processed foods, low physical activity, excess visceral fat, poor sleep, chronic stress, family history and PCOS.
Certain medications can also raise HbA1c, including corticosteroids, some antipsychotics and some diuretics. Conditions that lengthen red blood cell lifespan, such as iron deficiency anaemia and vitamin B12 or folate deficiency, can falsely elevate HbA1c even when glucose is normal. This is why abnormal results should always be checked in context.
What are the symptoms of low HbA1c %?
A low HbA1c in someone without diabetes is often not symptomatic and can simply reflect good glucose control. However, if the low result is caused by an underlying condition affecting your red blood cells, you may notice symptoms of anaemia such as fatigue, breathlessness, pale skin, dizziness or a rapid heartbeat. In people taking glucose-lowering medication, a very low HbA1c may indicate frequent hypoglycaemia, which can cause shakiness, sweating, confusion, hunger or blurred vision.
Symptoms like these should always be reviewed by a GP rather than self-managed, particularly if they appear alongside other changes in your health.
What causes low HbA1c %?
A genuinely low HbA1c can reflect excellent glucose control, particularly in people following a healthy lifestyle. However, several non-glucose factors can artificially lower the result. These include conditions that shorten red blood cell lifespan, such as haemolytic anaemia, recent significant blood loss, recent transfusion, chronic liver disease, some haemoglobinopathies and treatment with erythropoietin. Pregnancy can also lower HbA1c due to changes in red blood cell turnover.
In people with diabetes, a low HbA1c may reflect over-treatment with glucose-lowering medication or insulin, leading to frequent hypoglycaemia. This is one of the situations where the number alone can be misleading without clinical context.
What does it mean if HbA1c % is outside the optimal range?
A higher-than-optimal HbA1c % suggests your average blood glucose has been running above healthy levels for weeks or months. Depending on your other markers and history, it may indicate insulin resistance, pre-diabetes or diabetes, and it is associated with a higher long-term risk of cardiovascular, kidney and metabolic disease. It does not diagnose any single condition on its own, and mild elevations often respond well to lifestyle change.
A very low HbA1c may reflect strong glucose control, but it can also point to red blood cell issues or, in people on medication, hypoglycaemia. Patterns over time, alongside related markers, are far more informative than any single reading.
Can HbA1c % be normal but something still be wrong?
Yes. HbA1c is an average, so it can look reasonable while blood glucose spikes and crashes throughout the day. This pattern, sometimes called glycaemic variability, is not captured by a single HbA1c reading but can still affect energy, weight, cardiovascular risk and long-term health. Continuous glucose monitoring often reveals these fluctuations well before HbA1c changes.
HbA1c can also be misleading when red blood cell turnover is affected. Iron deficiency, B12 or folate deficiency, kidney disease, pregnancy, haemoglobinopathies and recent blood loss can all cause the result to over- or underestimate true average glucose. This is why HbA1c is best interpreted alongside fasting glucose, fasting insulin, a full blood count and iron studies.
What other markers should be checked with HbA1c %?
Fasting glucose is a close companion, since it captures a single-point view of blood sugar to complement the longer-term picture from HbA1c. Fasting insulin and the calculated HOMA-IR index add insight into insulin resistance, which often develops years before HbA1c starts to rise. Lipids, particularly triglycerides and HDL cholesterol, help round out cardiometabolic risk, as high triglycerides and low HDL commonly appear alongside insulin resistance.
Additional useful markers include ALT and GGT for liver health, hs-CRP for low-grade inflammation, a full blood count and iron studies to check red blood cell health (since these can affect HbA1c interpretation), and kidney markers such as eGFR and urinary ACR. You can see the full set of markers Vively looks at through our tests page and shop tests page.
How can you improve HbA1c % to a healthier level?
HbA1c responds well to consistent lifestyle change over weeks and months. That typically means building meals around protein, vegetables, legumes, whole grains and healthy fats, while reducing sugary drinks, refined carbohydrates and ultra-processed foods. Regular movement helps significantly, especially strength training, aerobic activity and short walks after meals to blunt post-meal glucose spikes.
Sleep of 7 to 9 hours, stress management and moderating alcohol also make a measurable difference. Not every marker can or should be self-optimised, and progress is often faster and more sustainable when guided by a clinician. Vively's how it works page explains how testing, continuous glucose monitoring and dietitian coaching come together to make change practical.
When does HbA1c % need medical review?
See your GP if your HbA1c sits in the pre-diabetes or diabetes range, is rising over time, or is accompanied by symptoms such as ongoing thirst, frequent urination, unexplained weight change, blurred vision, recurrent infections or fatigue. A very low HbA1c alongside symptoms of anaemia, or in someone taking glucose-lowering medication, also warrants review.
Clinical input is particularly important in pregnancy or when planning pregnancy, with a history of gestational diabetes, PCOS, cardiovascular disease, kidney disease or fatty liver disease, and when starting or changing medications that affect glucose. HbA1c should never be self-diagnosed, as it is one piece of a bigger clinical picture your GP, endocrinologist or accredited practising dietitian can help you interpret.
How does Vively help you understand HbA1c %?
HbA1c is one of the metabolic markers included in the Vively Baseline Health Check, alongside fasting glucose, fasting insulin, lipids, liver enzymes, inflammation markers, hormones and more than 60 other biomarkers. Rather than looking at HbA1c in isolation, Vively interprets it in context with your other results, symptoms, lifestyle and, where relevant, your real-world glucose data from a continuous glucose monitor.
An accredited practising dietitian reviews your results with you one on one, helping you understand what they mean and what changes may support your health goals. Because your markers are retested over time, you can see how nutrition, movement, sleep and stress are actually shifting the numbers, not just guessing. Start at the Vively homepage or explore the full range of tests in the Vively shop.
References
- Royal College of Pathologists of Australasia. RCPA Manual: Haemoglobin A1c. https://www.rcpa.edu.au/Manuals/RCPA-Manual/Pathology-Tests/H/Haemoglobin-A1c
- Healthdirect Australia. HbA1c test. https://www.healthdirect.gov.au/hba1c-test
- Diabetes Australia. HbA1c and blood glucose monitoring. https://www.diabetesaustralia.com.au/managing-diabetes/blood-glucose-monitoring/
- Royal Australian College of General Practitioners. Management of type 2 diabetes: A handbook for general practice. https://www.racgp.org.au/clinical-resources/clinical-guidelines/key-racgp-guidelines/view-all-racgp-guidelines/management-of-type-2-diabetes
- Better Health Channel, Victorian Department of Health. Diabetes type 2. https://www.betterhealth.vic.gov.au/health/conditionsandtreatments/diabetes-type-2
- Australian Institute of Health and Welfare. Diabetes: Australian facts. https://www.aihw.gov.au/reports/diabetes/diabetes/
- National Glycohemoglobin Standardization Program (NGSP). HbA1c standardisation and NGSP/DCCT reporting. https://ngsp.org/
- World Health Organization. Use of glycated haemoglobin (HbA1c) in the diagnosis of diabetes mellitus. https://www.who.int/publications/i/item/use-of-glycated-haemoglobin-(-hba1c-)-in-the-diagnosis-of-diabetes-mellitus
- Cleveland Clinic. A1c test. https://my.clevelandclinic.org/health/diagnostics/9731-a1c
- Mayo Clinic. A1C test. https://www.mayoclinic.org/tests-procedures/a1c-test/about/pac-20384643
- National Institute of Diabetes and Digestive and Kidney Diseases. The A1c test and diabetes. https://www.niddk.nih.gov/health-information/diagnostic-tests/a1c-test




















.avif)


.svg)