All Tests
/
Blood Testing
/
HOMA-IR Test
Blood Testing

HOMA-IR Test

The Homeostatic Model Assessment for Insulin Resistance (HOMA-IR) Score estimates how efficiently your body responds to insulin using fasting glucose and insulin values. In Australia, an optimal score sits around 1.0, with higher numbers (above 2.9) suggesting reduced insulin sensitivity.

Tracking HOMA-IR helps you see how lifestyle, diet, and sleep influence your metabolic efficiency. Even small improvements can enhance energy, body composition, and long-term vitality.

HOMA-IR is available in Vively's Metabolic Essentials Test. Book your blood test now for only $199 per test.
Book My TestOrder My CGM

What is the HOMA-IR Score?

HOMA-IR (Homeostatic Model Assessment for Insulin Resistance) is a mathematical calculation that combines your fasting insulin (µU/mL) and fasting glucose (mmol/L) values to estimate how efficiently your body responds to insulin in a resting (fasted) state. It is widely used in research and health optimisation contexts as a proxy for insulin sensitivity.

Why does it matter for long-term health and wellbeing?

Insulin plays a central role in how your body handles energy substrates (glucose, fat). High insulin resistance means the body must overcompensate, which stresses metabolic pathways, may promote visceral fat storage, and reduces metabolic flexibility. Over time, this can subtly degrade your capacity for physical performance, recovery, and healthy ageing—even before “lab alarms” appear. Monitoring HOMA-IR gives you early insight into insulin function, giving you the opportunity to course correct proactively.

What’s an optimal level of HOMA-IR?

  • Reference (lab) range: ~ 0.5 to 2.9 (Australian context)
  • Optimal / target range: a value close to 1.0 is often considered ideal (i.e. good insulin sensitivity)
  • Values somewhat above 1.0 suggest reduced sensitivity, and values approaching the upper lab limit (2.9) or above may merit closer attention.

Because research populations differ, many studies propose cut-offs for “insulin resistance risk” in the range ~ 1.6 to ~ 2.0. Some studies use ≥ 2.3 or ≥ 2.5 as thresholds for concern. Always consider your trend over time and other metabolic biomarkers.

What influences HOMA-IR levels?

Many modifiable and non-modifiable factors influence your HOMA-IR:

  • Body composition & fat distribution, especially visceral (abdominal) fat
  • Dietary patterns, glycaemic load, carbohydrate quality
  • Exercise and physical activity, particularly strength training and insulin-sensitive muscle mass
  • Sleep quality and duration, circadian alignment
  • Chronic stress and cortisol dynamics
  • Genetics, age, sex, and hormonal milieu
  • Inflammation and gut health
  • Medication use or supplements (in contexts outside wellness scope)

What does it mean if my HOMA-IR is outside the optimal range?

If your HOMA-IR rises above your optimal zone (e.g. above ~1.0) or moves toward the upper lab limit (2.9), it suggests your body is compensating by increasing insulin output to maintain glucose balance. Over time, this compensation becomes more energetically costly and can erode metabolic resilience. A persistently elevated HOMA-IR may signal the need to re-evaluate nutrition, physical activity, stress, sleep or other metabolic supports before signs become more obvious.

How can I support healthy HOMA-IR levels?

  • Prioritise lean mass maintenance through resistance training and progressive load
  • Choose lower glycaemic load foods and emphasise whole, minimally processed carbs
  • Time protein, fibre, healthy fats and carbohydrate intake in a metabolism-aware way
  • Improve sleep hygiene, consistency, and duration
  • Manage stress via mindfulness, breathing techniques, or recovery practices
  • Monitor trends (HOMA-IR + other markers) over months, not day to day
  • Adjust frequency of testing depending on your trajectory and lifestyle shifts

This information is provided for general health and wellness purposes only and does not replace medical advice.

References

  1. Pathology Tests Explained. (2025). Tests – Insulin
  2. Schneider, H., et al. (2003). Guidelines for the detection of diabetes mellitus. PMC, National Center for Biotechnology Information.
  3. Tate, J. R., et al. (2014). Harmonising adult and paediatric reference intervals in Australia and New Zealand: An evidence-based approach. PMC, National Center for Biotechnology Information.
Comprehensive test

Discover 50+ biomarkers
that shape your health

Take the test
Biological Age
1 marker

Biological age

A reflection of how your body is aging at the cellular level, linked to age risks and longevity.
Red Blood Cell (RBC) Count
Haemoglobin
Haematocrit
Mean Cell Volume (MCV)
Mean Cell Haemoglobin (MCH)
Mean Cell Haemoglobin Concentration (MCHC)
Red Cell Distribution Width (RDW)
Platelet Count
8 markers

Blood health

Key blood indicators like hemoglobin, inflammation, and oxygen transport for overall health.
Cholesterol Ratio
HDL Cholesterol
LDL Cholesterol
Non-HDL Cholesterol
Total Cholesterol
Triglycerides
6 markers

Heart health

Assesses cardiovascular health through cholesterol, lipids, and heart-related risk markers.
Cortisol
Dehydroepiandrosterone Sulfate (DHEA-S)
Free Thyroxine (T4)
Free Triiodothyronine (T3)
Thyroid stimulating hormone (TSH)
5 markers

Hormone balance

Evaluates hormone levels that impact energy, sleep, mood, and metabolism.
White Blood Cell (WBC) Count
Neutrophils
Lymphocytes
Monocytes
Eosinophils
Basophils
6 markers

Immune system

Measures immune activity and inflammatory responses to assess body defenses.
High-Sensitivity C-Reactive Protein (hs-CRP)
1 marker

Inflammation status

Tracks signs of chronic or acute inflammation that may affect long-term disease risk.
Bicarbonate
Chloride
Creatinine
Potassium
Sodium
Urea
Uric acid
Anion Gap
Estimated Glomerular Filtration Rate (EGFR)
9 markers

Kidney function

Assesses kidney health through creatinine and other markers of blood filtration.
Alanine Aminotransferase
Albumin
Alkaline Phosphatase
Aspartate aminotransferase (AST)
Bilirubin
Gamma-glutamyl Transferase (GGT)
Globulin
Total Protein
8 markers

Liver health

Measures liver enzymes and proteins responsible for detoxification and metabolic health.
Fasting Glucose
Fasting Insulin
Haemoglobin A1c (HbA1c) IFCC mmol/m
Haemoglobin A1c (HbA1c) NGSP/DCCT %
HOMA-IR score
5 markers

Metabolic health

Evaluates energy processing with glucose, HbA1c, insulin, and related biomarkers.
Magnesium
1 marker

Vitamins & minerals

Analyzes essential nutrients that support immunity, energy, and overall wellbeing.
Creatine Kinase
1 marker

Muscle strength

Assesses biomarkers related to muscle performance, function, and recovery.
Biological Age
1 marker

Biological age

A reflection of how your body is aging at the cellular level, linked to age risks and longevity.
How it works

Get a clearer picture of your health and weight

01

Schedule your test

Visit one of 4,000 collection centres across Australia at your earliest convenience and take one blood draw
02

Get your results

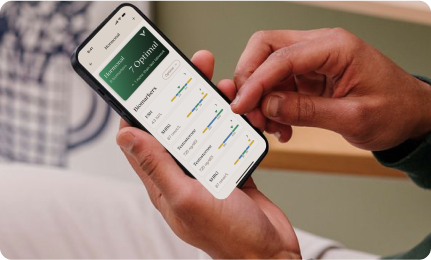
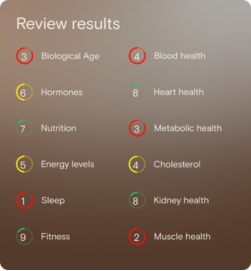
Review your 50+ biomarkers in the Vively app and get a full breakdown, including your Biological Age and Speed of Ageing.
03

Take control of your health

Track and improve your health through the app, with expert 1:1 support available with dietitian coaches to guide healthy changes
FAQ

Got Questions? We’ve Got Answers

What's included in the blood test?
How is this different from getting a blood test at my GP?
What is the Vively membership?
Why do you test these specific biomarkers?
What happens to my data?