All Tests
/
Blood Testing
/
Iron
★★★★★
Trusted by 30,000+ Australians
Blood Testing

Iron Blood Test: What Low, High and Optimal Iron Levels Mean.

Serum iron, measured in µmol/L, reflects the amount of iron circulating in the blood bound to transferrin. Because it fluctuates throughout the day and in response to diet and inflammation, results are most useful when interpreted alongside ferritin, transferrin, and transferrin saturation. Tracking serum iron helps clarify iron availability for oxygen transport and energy production, and keeping levels within range supports stamina, cognitive clarity, and long-term metabolic resilience.

Check Iron and 70+ markers with Vively's Baseline Health Check - only $99 today.
Dr Michelle Woolhouse
July 1, 2026
Book My Test
Book My Test
Same-day pathology referral | 4,000+ Testing Locations in AU | Results in 2-3 days
Order My CGM

What is serum iron?

Serum iron measures the amount of iron currently circulating in the bloodstream, most of which is bound to the transport protein transferrin. Unlike ferritin, which reflects stored iron, serum iron captures a snapshot of iron in active transit. Because it varies considerably across the day and with recent food intake, it is interpreted as part of a full iron studies panel rather than on its own.

Why does it matter for long-term health and wellbeing?

Iron is essential for haemoglobin production, oxygen delivery, energy metabolism, and immune function. Serum iron contributes to the broader iron studies picture, helping distinguish between iron deficiency, iron overload, and inflammatory processes. Low serum iron alongside low ferritin and high TIBC points toward iron deficiency, which can affect endurance, concentration, and mood before anaemia develops. Elevated serum iron may indicate iron overload or recent supplementation. Monitoring serum iron within a panel supports early identification of imbalances that influence performance and long-term wellbeing.

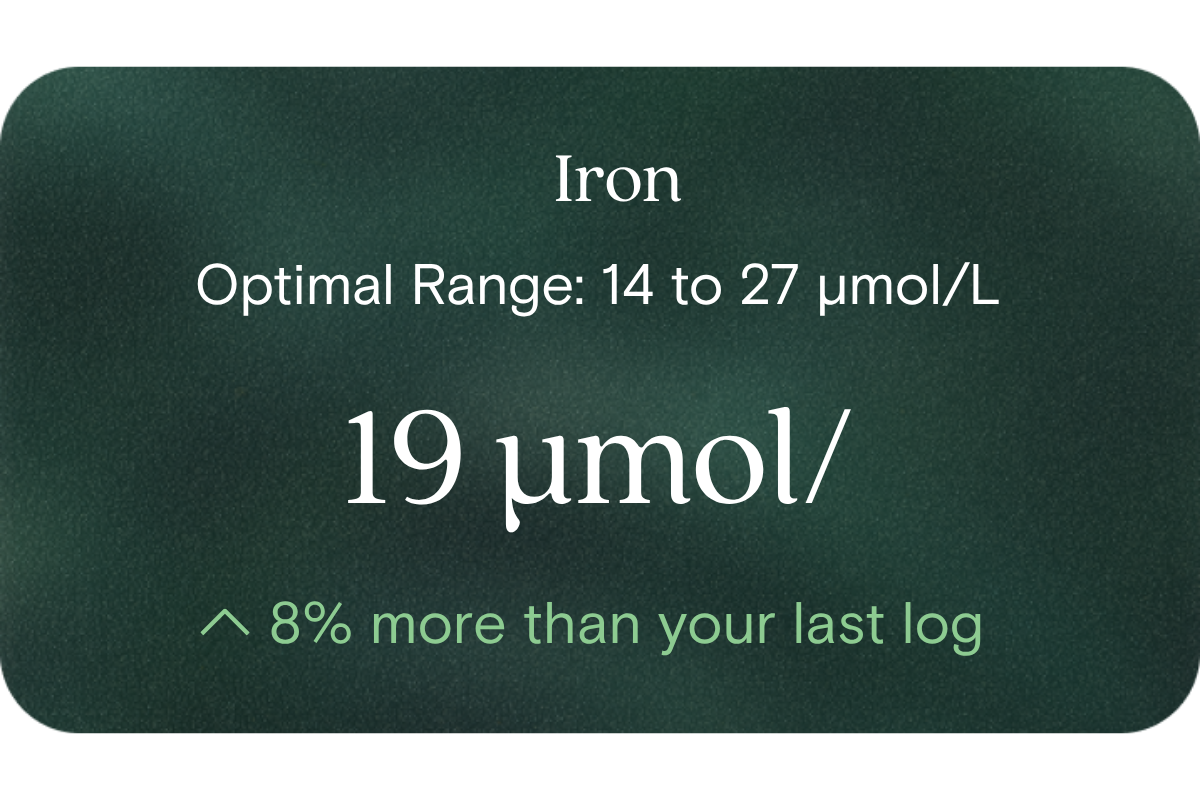
What's an optimal level of serum iron?

  • Laboratory reference: 10 to 30 µmol/L
  • Optimal (as per your framework): 14 to 27 µmol/L
  • Note: serum iron fluctuates throughout the day, so Australian pathology labs interpret it alongside ferritin and transferrin saturation rather than in isolation.

What influences serum iron levels?

  • Dietary iron intake and recent meals (levels rise after eating iron-rich food or supplements)
  • Time of day (serum iron is typically higher in the morning)
  • Iron stores and absorption capacity (gut health, coeliac disease)
  • Inflammation or infection (tends to lower serum iron)
  • Blood loss (menstruation, gastrointestinal bleeding)
  • Genetic conditions such as hereditary haemochromatosis that increase iron absorption

What does it mean if serum iron is outside the optimal range?

  • Below optimal / low serum iron: May indicate iron deficiency, poor absorption, blood loss, or chronic inflammation. Most meaningful when accompanied by low ferritin and elevated TIBC.
  • Above optimal / high serum iron: May suggest iron overload, recent supplementation, or a genetic condition such as haemochromatosis. Elevated serum iron always needs interpretation alongside ferritin and transferrin saturation.

How to support healthy serum iron levels?

  • Consume iron-rich foods, including heme sources such as lean red meat, poultry, and fish, and plant sources paired with vitamin C to aid absorption
  • Support gut health to optimise absorption and reduce intestinal inflammation
  • Address any sources of blood loss with a healthcare practitioner
  • Avoid taking iron supplements without confirmed deficiency, as excess iron can be harmful
  • Retest serum iron alongside ferritin, transferrin, and transferrin saturation to build a complete picture of iron status

This information is provided for general health and wellness purposes only and does not replace medical advice.

References

  1. Royal College of Pathologists of Australasia. (2021). Iron Studies – Standardised Reporting Protocol (Second Edition). Surry Hills, NSW: RCPA.
  2. Camaschella, C. (2015). Iron-deficiency anaemia. New England Journal of Medicine, 372(19), 1832–1843.
  3. Pasricha, S. R., Tye-Din, J., Muckenthaler, M. U., & Swinkels, D. W. (2021). Iron deficiency. The Lancet, 397(10270), 233–248.

Ready to understand your [marker name] in context?  

Vively's Baseline Health Check reviews [marker name] alongside iron studies, full blood count, inflammation, liver health, metabolic markers and 70+ other biomarkers, then turns your results into a personalised plan.  Start My Baseline Health Check

What we measure

 70+ biomarkers analysed, each one tells you something specific about how your body is functioning right now, not just whether you're "sick" or "not sick"

Understand markers linked to healthy aging

A reflection of how your body is aging at the cellular level, linked to age risks and longevity.

  • Biological Age
  • Speed of Aging

Understand how your body regulates energy

Review glucose, insulin and lipid markers associated with metabolic balance.

  • Fasting Glucose
  • Fasting Insulin
  • Haemoglobin A1c (HbA1c) IFCC mmol/m
  • Haemoglobin A1c (HbA1c) NGSP/DCCT %
  • HOMA-IR
  • Uric Acid/HDL-C (UHR)
  • TyG index
  • Sodium/Potassium Ratio
  • hs-CRP / HDL Ratio

See how your blood supports oxygen and energy

Key blood indicators like hemoglobin, inflammation, and oxygen transport for overall health.

  • Mean Cell Volume (MCV)
  • Red Blood Cell (RBC) Count
  • Haemoglobin
  • Haematocrit
  • Red cell distribution width (RDW)
  • Mean Cell Haemoglobin (MCH)
  • Mean Cell Haemoglobin Concentration (MCHC)
  • Platelet count

Review advanced cardiovascular risk markers

Analyse lipid balance and related markers linked to long-term heart and vascular wellbeing.

  • Total Cholesterol
  • LDL Cholesterol
  • HDL Cholesterol
  • Non-HDL Cholesterol
  • Cholesterol Ratio
  • Triglycerides
  • Cholesterol/HDL Ratio
  • Total Cholesterol/HDL Ratio
  • LDL/HDL Ratio
  • Triglyceride/HDL Cholesterol (Molar Ratio)
  • Non-HDL Cholesterol/Total Cholesterol (Mass Ratio)
  • Atherogenic Index of Plasma (AIP)

See how your immune system is functioning

Review white blood cell markers that reflect immune activity and response.

  • White Blood Cell (WBC) Count
  • Neutrophils
  • Lymphocytes
  • Eosinophils
  • Basophils
  • Neutrophil-to-Lymphocyte Ratio
  • Neutrophil-to-HDL Cholesterol Ratio (NHR)
  • Platelet/Lymphocyte Ratio
  • Monocytes

Identify markers linked to systemic inflammation

Assess signals associated with inflammatory balance and overall physiological stress.

  • High-Sensitivity C-Reactive Protein (hs-CRP)
  • CRP/Albumin Ratio (CAR)
  • Systemic Inflammation Index (SII)

Monitor markers related to kidney function

Review indicators that reflect how efficiently your kidneys filter and regulate fluids.

  • Chloride
  • Bicarbonate
  • Sodium
  • Potassium
  • Urea
  • Creatinine
  • BUN/Creatinine Ratio
  • Estimated Glomerular Filtration Rate (eGFR)
  • Anion Gap

Assess markers connected to liver health

Understand enzymes and related markers linked to metabolic processing and detoxification pathways.

  • Alkaline Phosphatase
  • Bilirubin
  • Aspartate aminotransferase (AST)
  • Gamma-glutamyl Transferase (GGT)
  • Alanine Aminotransferase (ALT)
  • Globulin
  • Total Protein
  • NAFLD FIB-4
  • Albumin/Globulin Ratio
  • Albumin

Check your thyroid function

Helps identify thyroid issues linked to energy, mood and weight.

  • Thyroid Stimulating Hormone (TSH)

Check key nutrient levels that support daily function

Assess essential vitamins and minerals linked to energy production, recovery and overall wellbeing.

  • Iron
  • Phosphate
  • Magnesium
  • Transferrin
  • Ferritin
  • Transferrin saturation
  • TIBC
  • Vitamin D
Get my baseline for $99
Why us?

What a standard check often leaves out

Your GP isn't the problem. The current health system isn't built for optimal health.

Vively
Standard GP check
Markers analysed
70+ markers
10-15 markers
Optimal ranges included
Biological age
Results reviewed with on-demand practitioner support
Personalised plan built around your results
Ongoing retesting and health trends reporting
How it works

Just 3 simple steps to get started

If needed, we'll recommend further testing to investigate potential issues based on your results

01

Take the test

One simple test to understand where your health stands. Visit one of 4,000 collection centres across Australia at your earliest convenience and take one easy blood draw.
02

Review your results

Meet with a registered health professional to identify what looks fine, what’s worth watching, and what (if anything) needs attention. If nothing needs changing, we’ll tell you that too.
03

Stay confident as life changes

After your baseline, Vively continues as ongoing guidance — helping you stay on track, adjust when something changes, and re-test every 3 months to see progress over time.
Get your health baseline
What's included

All of this, for only $99/month

Everything below is included from day one. Cancel anytime.

Practitioner support

  • Test reviews and guidance from a registered nurse trained in optimal health
  • Dietitian support for nutrition and lifestyle changes
  • Plan updates whenever your results change

Ongoing monitoring

  • A full Baseline available every 3 months
  • See every marker trend over time
  • Programs matched to your results

All-in-one mobile app

  • Unlimited AI health intelligence
  • Food tracking and wearables integrations
  • Cycle tracking, journal, and insights
  • Member pricing on additional tests

FAQs

Does this include a blood test?
How do I take the blood test in Australia?
What if I just want the Baseline and don't want a membership?
Can't I just ask my GP to order these tests?
What happens after my Baseline?
What if nothing's wrong?
How long does it take?
Are all markers included for every person?
How does the 100% Money Back Guarantee work?
What happens to my data?
How often do I get retested?