LDL/HDL Ratio Blood Test: What Low, High and Optimal LDL/HDL Ratio Levels Mean.
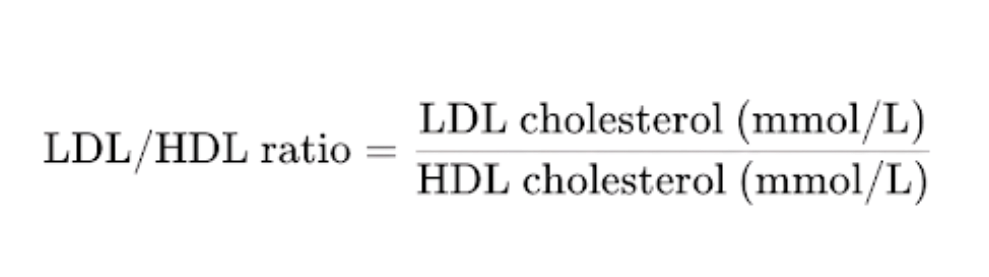
The LDL-to-HDL ratio compares your LDL (“bad”) cholesterol to your HDL (“good”) cholesterol, both measured in mmol/L. It shows the balance between cholesterol buildup and removal, providing a clearer view of overall lipid health.
Keeping this ratio low supports efficient fat metabolism, vascular health, and long-term wellbeing. Tracking it over time helps you make early lifestyle adjustments that strengthen energy balance and cardiovascular resilience.
Check LDL/HDL Ratio and 70+ markers with Vively's Baseline Health Check - only $99 today.
It expresses the relative quantity of “bad” cholesterol-carrying lipoproteins (LDL) versus “good” cholesterol-carrying lipoproteins (HDL). The lower the number, the greater the proportion of HDL relative to LDL — and the more favourable the lipid transport balance.
Why does it matter for long-term health and wellbeing?
Lipids influence how efficiently your body transports, uses and clears cholesterol — which in turn affects vascular flexibility, organ perfusion and metabolic resilience. A more favourable LDL/HDL ratio suggests better lipid turnover, less “traffic” of cholesterol in the wrong places, and improved support for energy delivery and metabolic homeostasis. While the ratio is not a guarantee of any outcome, tracking it helps you view your lipid system in a dynamic way and optimise for performance, recovery and longevity through modifiable lifestyle levers.
What’s an optimal level of LDL/HDL Ratio?
Optimal range (for performance, longevity, wellness context): < 2.0 (unitless)
Typical reference (lab) range: varies by laboratory, population and context. Some literature suggests values up to ~3.0-4.0 may be seen as “average” rather than optimal.
Use the optimal range above as a target for best-practice, and your lab’s reference values for context.
Regular physical activity, especially aerobic and resistance training
Body weight and fat distribution; central adiposity tends to unfavourably influence lipids
Sleep quality and recovery (poor sleep can adversely influence lipids)
Genetics (baseline HDL- and LDL-related gene variants)
Smoking and alcohol intake
Other metabolic factors such as insulin sensitivity, inflammation and how your body handles lipids.
Since many of these are modifiable, you have real scope to improve the ratio over time.
What does it mean if your LDL/HDL Ratio is outside the optimal range?
If your ratio is higher than your target (< 2.0) it suggests that your LDL cholesterol is disproportionately high relative to HDL, meaning your body may be less effective at clearing cholesterol and maintaining optimum lipid flow. In a wellness and performance context, it means you have a clear actionable insight: you’re in a zone where lifestyle levers (nutrition, training, recovery) might meaningfully shift the balance, improving your metabolic performance and future resilience. It’s not a “disease” label—it’s an opportunity to optimise.
How can I support healthy LDL/HDL Ratio levels?
Here are key levers to consider:
Prioritise whole-food, minimally processed diet: plenty of high-quality protein, healthy fats (e.g. monounsaturated, omega-3), high-fibre vegetables and low refined carbs.
Maintain a consistent exercise routine: both moderate-vigorous aerobic work (e.g. brisk walking, cycling) and resistance training help improve HDL and reduce LDL.
Manage body composition: reducing excess body fat, especially around the mid-section, tends to improve lipid profiles.
Ensure good sleep quality and sufficient duration: poor sleep undermines metabolic regulation including lipid metabolism.
Avoid smoking and moderate alcohol intake (as per Australian guidelines).
Monitor regularly: tracking the ratio over time gives feedback on how your lifestyle is influencing your lipid balance — you’ll see trends and can fine-tune your plan based on real data.
This information is provided for general health and wellness purposes only and does not replace medical advice.
References
Sun, T., et al. (2022). Predictive value of LDL/HDL ratio in coronary atherosclerotic heart disease. BMC Cardiovascular Disorders, 22.
“Cholesterol facts.” CSIRO.
Barter, P.J. (1994). HDL cholesterol testing: implications for clinical management. Australian Prescriber, 17(4), 99-102.
LDL/HDL Ratio
Ready to understand your [marker name] in context?
Vively's Baseline Health Check reviews [marker name] alongside iron studies, full blood count, inflammation, liver health, metabolic markers and 70+ other biomarkers, then turns your results into a personalised plan. Start My Baseline Health Check
70+ biomarkers analysed, each one tells you something specific about how your body is functioning right now, not just whether you're "sick" or "not sick"
Understand markers linked to healthy aging
A reflection of how your body is aging at the cellular level, linked to age risks and longevity.
Biological Age
Speed of Aging
Understand how your body regulates energy
Review glucose, insulin and lipid markers associated with metabolic balance.
Fasting Glucose
Fasting Insulin
Haemoglobin A1c (HbA1c) IFCC mmol/m
Haemoglobin A1c (HbA1c) NGSP/DCCT %
HOMA-IR
Uric Acid/HDL-C (UHR)
TyG index
Sodium/Potassium Ratio
hs-CRP / HDL Ratio
See how your blood supports oxygen and energy
Key blood indicators like hemoglobin, inflammation, and oxygen transport for overall health.
Mean Cell Volume (MCV)
Red Blood Cell (RBC) Count
Haemoglobin
Haematocrit
Red cell distribution width (RDW)
Mean Cell Haemoglobin (MCH)
Mean Cell Haemoglobin Concentration (MCHC)
Platelet count
Review advanced cardiovascular risk markers
Analyse lipid balance and related markers linked to long-term heart and vascular wellbeing.
Your GP isn't the problem. The current health system isn't built for optimal health.
Vively
Standard GP check
Markers analysed
70+ markers
10-15 markers
Optimal ranges included
Biological age
Results reviewed with on-demand practitioner support
Personalised plan built around your results
Ongoing retesting and health trends reporting
How it works
Just 3 simple steps to get started
If needed, we'll recommend further testing to investigate potential issues based on your results
01
Take the test
One simple test to understand where your health stands. Visit one of 4,000 collection centres across Australia at your earliest convenience and take one easy blood draw.
02
Review your results
Meet with a registered health professional to identify what looks fine, what’s worth watching, and what (if anything) needs attention. If nothing needs changing, we’ll tell you that too.
03
Stay confident as life changes
After your baseline, Vively continues as ongoing guidance — helping you stay on track, adjust when something changes, and re-test every 3 months to see progress over time.
Vively is a general wellness platform and does not provide medical advice, diagnosis, or treatment. Any information, insights or guidance offered through our app, website, programs, or coaches is for educational and informational purposes only and should not be considered a substitute for professional medical advice or care. Always consult a qualified healthcare provider before making any health-related decisions.
We acknowledge the Traditional Custodians of the lands where we live and work, the Gadigal of the Eora Nation. We pay our respects to their Elders past and present.


.png)

.svg)

