Blood Testing

Lymphocytes Ratio

The Lymphocytes Ratio shows the percentage of lymphocytes within your total white blood cell count, typically 20–40 % in Australian labs. These cells are key to adaptive immunity, helping your body recognise and respond to challenges. An optimal range of 25–35 % reflects balanced immune activity and overall resilience.

Tracking this ratio helps reveal how your body adapts to stress, recovery, and lifestyle changes. Monitoring trends allows early adjustments in sleep, nutrition, and stress management to support immune balance and long-term wellbeing.

Lymphocytes Ratio is available in Vively's Metabolic Essentials Test. Book your blood test now for only $199 per test.
Book My TestOrder My CGM

What is Lymphocytes Ratio?

It is the percentage of your total white blood cell count that is made up of lymphocytes. In a standard blood differential (part of a full blood count), the lab reports lymphocytes both in absolute count and as a percentage.

Why does it matter for long-term health and wellbeing?

This ratio offers a lens into your immune system’s “orientation.” A balanced lymphocyte ratio suggests your body is neither overly stressed nor stuck in low immune vigilance. Over time, swings beyond your optimal zone may hint at chronic stress load, low-grade inflammation, or suboptimal recovery states — all factors that subtly influence metabolism, energy, ageing, and your body’s capacity to adapt.

What’s an optimal level of Lymphocytes Ratio?

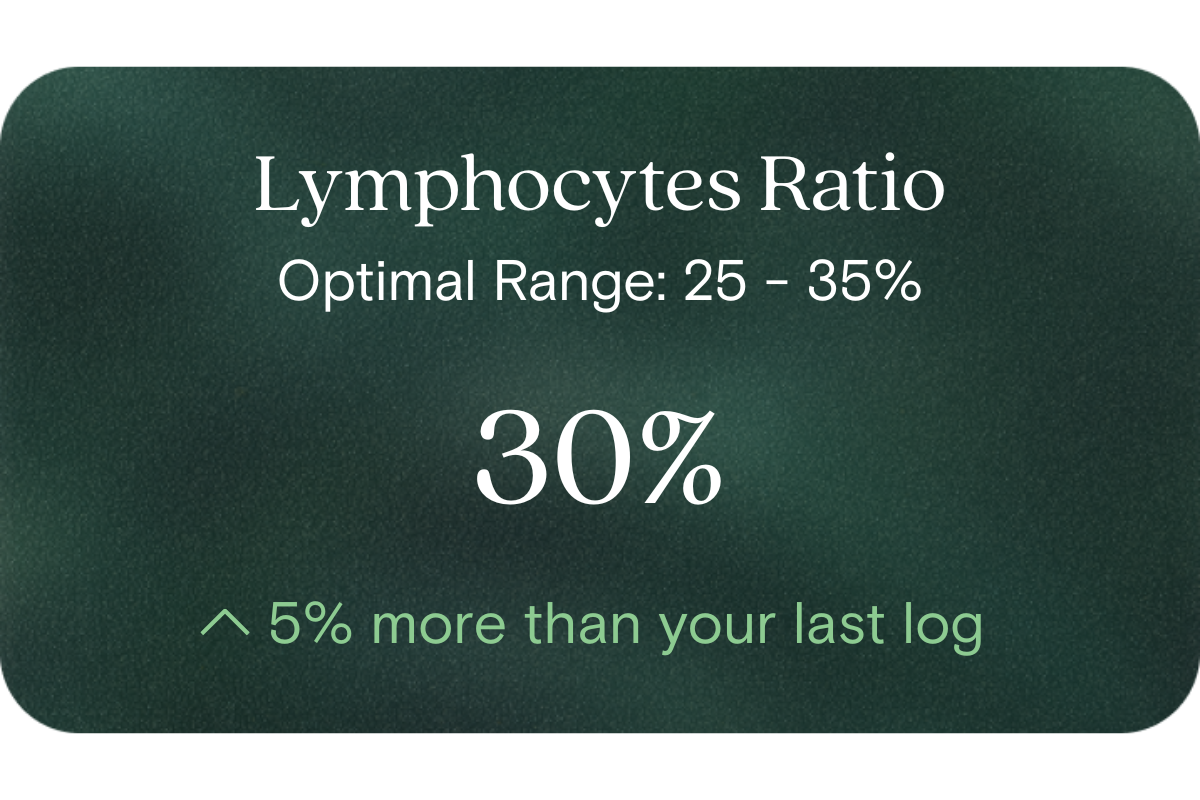
  • Reference (lab) range: 20 % to 40 %
  • Vively’s suggested optimal range: ~ 25 % to 35 %

If your ratio sits within that narrower band, it suggests a more balanced immune profile aligned with performance, resilience, and longevity goals.

What influences Lymphocytes Ratio levels?

Many lifestyle and internal factors can shift your lymphocyte ratio, including:

  • Chronic stress and sleep disruption — via cortisol and immune regulation pathways
  • Acute or low-grade inflammation (e.g. from diet, lifestyle)
  • Physical activity (both too little or excessive load)
  • Nutritional status (micronutrients, protein intake)
  • Ageing and immunosenescence dynamics
  • Lifestyle exposures (e.g. smoking, environmental pollutants)

Studies of immune ageing find that the balance of neutrophils and lymphocytes shifts over decades, and that stress accelerates that drift.

What does it mean if Lymphocytes Ratio is outside the optimal range?

  • Below ~25 % may suggest that your immune system is under strain or skewed toward rapid-response (innate) pathways — possibly higher day-to-day stress or inflammation burden.
  • Above ~35 % (and toward 40 % or more) may hint at overactivity or imbalance in adaptive immune function — for example, more immune “alertness” load or slower resolution of immune stimuli.

Either direction, consistent deviation signals an opportunity to re-examine recovery, stress load, lifestyle, and immune balance before things escalate.

How can I support healthy Lymphocytes Ratio levels?

You can use lifestyle levers to gently guide your lymphocyte ratio toward balance:

  • Prioritise rest, high-quality sleep, and circadian consistency
  • Use stress-modulation tools: mindfulness, breathwork, structured downtime
  • Eat a whole-food, micronutrient-rich diet with anti-inflammatory support
  • Moderate and periodise physical activity (avoid chronic overtraining)
  • Support gut health and microbiome diversity
  • Minimise exposures to toxins, pollutants, cigarette smoke, and chronic low-grade stressors

This information is provided for general health and wellness purposes only and does not replace medical advice.

References

  1. UCSF Health. Blood differential test: normal ranges for leukocytes.
  2. Apollo 247. LYM blood test – percentage normal ranges.
  3. Pellegrino, R. et al. Temporal trends, sex differences, and age-related influence in neutrophil & lymphocyte counts. Immun Ageing (2023).
  4. Klopack, E. T. et al. Social stressors associated with T lymphocyte ageing. PNAS (2022).
Comprehensive test

Discover 50+ biomarkers
that shape your health

Take the test
Biological Age
1 marker

Biological age

A reflection of how your body is aging at the cellular level, linked to age risks and longevity.
Red Blood Cell (RBC) Count
Haemoglobin
Haematocrit
Mean Cell Volume (MCV)
Mean Cell Haemoglobin (MCH)
Mean Cell Haemoglobin Concentration (MCHC)
Red Cell Distribution Width (RDW)
Platelet Count
8 markers

Blood health

Key blood indicators like hemoglobin, inflammation, and oxygen transport for overall health.
Cholesterol Ratio
HDL Cholesterol
LDL Cholesterol
Non-HDL Cholesterol
Total Cholesterol
Triglycerides
6 markers

Heart health

Assesses cardiovascular health through cholesterol, lipids, and heart-related risk markers.
Cortisol
Dehydroepiandrosterone Sulfate (DHEA-S)
Free Thyroxine (T4)
Free Triiodothyronine (T3)
Thyroid stimulating hormone (TSH)
5 markers

Hormone balance

Evaluates hormone levels that impact energy, sleep, mood, and metabolism.
White Blood Cell (WBC) Count
Neutrophils
Lymphocytes
Monocytes
Eosinophils
Basophils
6 markers

Immune system

Measures immune activity and inflammatory responses to assess body defenses.
High-Sensitivity C-Reactive Protein (hs-CRP)
1 marker

Inflammation status

Tracks signs of chronic or acute inflammation that may affect long-term disease risk.
Bicarbonate
Chloride
Creatinine
Potassium
Sodium
Urea
Uric acid
Anion Gap
Estimated Glomerular Filtration Rate (EGFR)
9 markers

Kidney function

Assesses kidney health through creatinine and other markers of blood filtration.
Alanine Aminotransferase
Albumin
Alkaline Phosphatase
Aspartate aminotransferase (AST)
Bilirubin
Gamma-glutamyl Transferase (GGT)
Globulin
Total Protein
8 markers

Liver health

Measures liver enzymes and proteins responsible for detoxification and metabolic health.
Fasting Glucose
Fasting Insulin
Haemoglobin A1c (HbA1c) IFCC mmol/m
Haemoglobin A1c (HbA1c) NGSP/DCCT %
HOMA-IR score
5 markers

Metabolic health

Evaluates energy processing with glucose, HbA1c, insulin, and related biomarkers.
Magnesium
1 marker

Vitamins & minerals

Analyzes essential nutrients that support immunity, energy, and overall wellbeing.
Creatine Kinase
1 marker

Muscle strength

Assesses biomarkers related to muscle performance, function, and recovery.
Biological Age
1 marker

Biological age

A reflection of how your body is aging at the cellular level, linked to age risks and longevity.
How it works

Get a clearer picture of your health and weight

01

Schedule your test

Visit one of 4,000 collection centres across Australia at your earliest convenience and take one blood draw
02

Get your results

Review your 50+ biomarkers in the Vively app and get a full breakdown, including your Biological Age and Speed of Ageing.
03

Take control of your health

Track and improve your health through the app, with expert 1:1 support available with dietitian coaches to guide healthy changes
FAQ

Got Questions? We’ve Got Answers

What's included in the blood test?
How is this different from getting a blood test at my GP?
What is the Vively membership?
Why do you test these specific biomarkers?
What happens to my data?