Blood Testing

Neutrophil-to-Lymphocyte Ratio

The Neutrophil-to-Lymphocyte Ratio (NLR) compares two types of white blood cells to show the balance between short-term immune activation and long-term defence. Calculated from a standard blood count, it offers an accessible snapshot of immune balance and low-grade inflammation.

Tracking NLR over time helps reveal how lifestyle factors like sleep, nutrition, and stress influence recovery, energy, and resilience. Monitoring this ratio supports proactive wellbeing by showing how well your immune system adapts to daily demands.

Neutrophil-to-Lymphocyte Ratio is available in Vively's Metabolic Essentials Test. Book your blood test now for only $199 per test.
Book My TestOrder My CGM

What is the Neutrophil-to-Lymphocyte Ratio (NLR)?

NLR is a simple ratio — the number of neutrophils divided by the number of lymphocytes in the peripheral blood. Neutrophils act as the body’s first-responders to stress and inflammation, while lymphocytes drive the adaptive immune response. When one arm of this balance shifts relative to the other, NLR can move, signalling a shift in immune and inflammatory status. 

Why does NLR matter for long-term health and wellbeing?

Maintaining a resilient immune system and low-grade inflammatory load are key to sustaining energy levels, efficient metabolism and healthy ageing. A stable, balanced NLR suggests your immune system is neither overly activated (which can drain resources) nor under-prepared. In contrast, shifts in NLR may indicate a need to adjust lifestyle inputs (sleep, nutrition, movement, stress) to keep your physiology primed for performance and recovery. Research shows NLR tracks immune-balance and inflammation across a wide range of contexts.

What’s an optimal level of NLR?

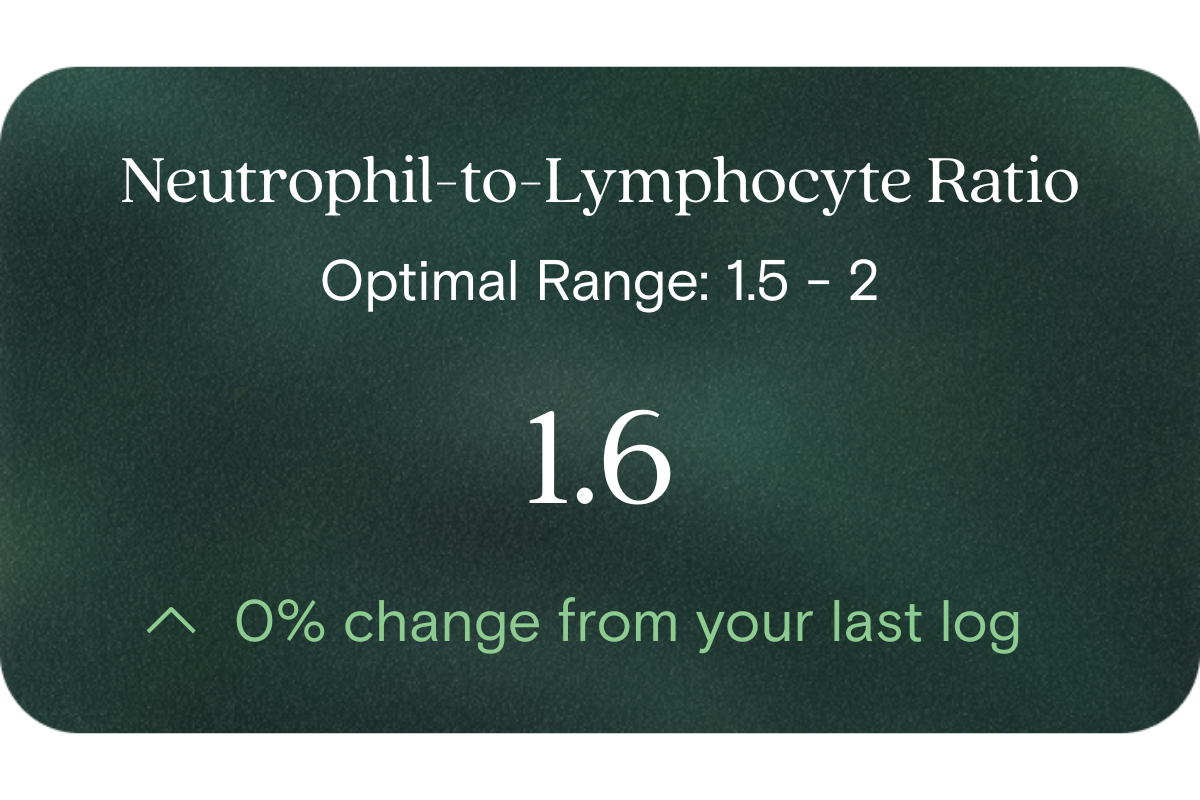
  • Reference (lab) range: for healthy adults, typical values fall roughly between ~0.78 and ~3.53 (unitless ratio) in general populations.
  • Optimal (for proactive health/performance) target: as a guideline, aiming for the lower end of that range (for example ~0.8–2.0) may indicate better immune-inflammatory balance.
  • Example reference values (for Australians via standard blood counts):

    • Reference range low: ~0.78
    • Reference range high: ~3.5
    • Optimal range low: ~0.8
    • Optimal range high: ~2.0

Individual variation applies, including age, sex, ethnicity and lab method — so your baseline and trends matter most.

What influences NLR levels?

Several lifestyle and physiological factors may influence NLR, including:

  • Acute physiological stress (e.g., intense exercise, surgery, sleep-deprivation) elevating neutrophils.
  • Dietary quality, body-composition and metabolic load (which can modulate activity of immune cells).
  • Sleep and recovery: poor sleep may drive elevated neutrophil counts and shift balance.
  • Chronic stress or low-grade inflammation (e.g., from obesity, metabolic imbalance, environmental exposures).
  • Ageing and immune-system adjustment: older individuals may show higher baseline NLR.

What does it mean if my NLR is outside the optimal range?

If your NLR is higher than your optimal target, it may signal that your immune-inflammatory balance is tilted toward elevated frontline activation (neutrophils) relative to adaptive capacity (lymphocytes). From a wellness-perspective this suggests your physiology may be under subtle stress, and that refining lifestyle inputs could help restore balance.

Conversely, if your NLR is lower than expected (though less commonly discussed), it might reflect an unusual shift in lymphocyte counts or immune responsiveness. In both cases the emphasis is on monitoring trend over time, not one isolated value, and using the result as an insight rather than a diagnosis.

How can I support healthy NLR levels?

To support a balanced NLR and therefore better immune-inflammatory balance:

  • Prioritise restorative sleep (7–9 hours for most adults) and minimise chronic sleep deprivation.
  • Use whole-food nutrition rich in anti-inflammatory nutrients (e.g., omega-3 fatty acids, colourful vegetables, fibre).
  • Maintain regular physical activity combined with adequate recovery — over-training may elevate neutrophil counts.
  • Manage stress (psychological, environmental, metabolic) through mindfulness, movement, social connection.
  • Maintain healthy body composition, metabolic health and avoid excess adiposity, which can fuel low-grade inflammation.
  • Monitor and optimise your other supporting biomarkers (e.g., sleep quality, resting heart-rate variability, nutrient status) to favour immune-balance.

This information is provided for general health and wellness purposes only and does not replace medical advice.

References

  1. Forget, P., Khalifa, C., Defour, J.-P., Latinne, D., Van Pel, A., De Kock, M. (2017). What is the normal value of the neutrophil-to-lymphocyte ratio? BMC Research Notes, 10:12.
  2. Lee, J.-S., Im, J.-S., Lee, S.-H., et al. (2018). Reference values of neutrophil-lymphocyte ratio, platelet-lymphocyte ratio, and mean platelet volume in healthy children and adults. Medicine, 97(26):e11151.
  3. Arvanitakis, F., et al. (2023). The neutrophil-to-lymphocyte ratio as a new prognostic factor in cancers: narrative review. Frontiers in Oncology, 13:1228076.
  4. Pagánelli, R., et al. (2025). The neutrophil-to-lymphocyte ratio in aging and immunity. Exploration Immunology, Article 1003200.
Comprehensive test

Discover 50+ biomarkers
that shape your health

Take the test
Biological Age
1 marker

Biological age

A reflection of how your body is aging at the cellular level, linked to age risks and longevity.
Red Blood Cell (RBC) Count
Haemoglobin
Haematocrit
Mean Cell Volume (MCV)
Mean Cell Haemoglobin (MCH)
Mean Cell Haemoglobin Concentration (MCHC)
Red Cell Distribution Width (RDW)
Platelet Count
8 markers

Blood health

Key blood indicators like hemoglobin, inflammation, and oxygen transport for overall health.
Cholesterol Ratio
HDL Cholesterol
LDL Cholesterol
Non-HDL Cholesterol
Total Cholesterol
Triglycerides
6 markers

Heart health

Assesses cardiovascular health through cholesterol, lipids, and heart-related risk markers.
Cortisol
Dehydroepiandrosterone Sulfate (DHEA-S)
Free Thyroxine (T4)
Free Triiodothyronine (T3)
Thyroid stimulating hormone (TSH)
5 markers

Hormone balance

Evaluates hormone levels that impact energy, sleep, mood, and metabolism.
White Blood Cell (WBC) Count
Neutrophils
Lymphocytes
Monocytes
Eosinophils
Basophils
6 markers

Immune system

Measures immune activity and inflammatory responses to assess body defenses.
High-Sensitivity C-Reactive Protein (hs-CRP)
1 marker

Inflammation status

Tracks signs of chronic or acute inflammation that may affect long-term disease risk.
Bicarbonate
Chloride
Creatinine
Potassium
Sodium
Urea
Uric acid
Anion Gap
Estimated Glomerular Filtration Rate (EGFR)
9 markers

Kidney function

Assesses kidney health through creatinine and other markers of blood filtration.
Alanine Aminotransferase
Albumin
Alkaline Phosphatase
Aspartate aminotransferase (AST)
Bilirubin
Gamma-glutamyl Transferase (GGT)
Globulin
Total Protein
8 markers

Liver health

Measures liver enzymes and proteins responsible for detoxification and metabolic health.
Fasting Glucose
Fasting Insulin
Haemoglobin A1c (HbA1c) IFCC mmol/m
Haemoglobin A1c (HbA1c) NGSP/DCCT %
HOMA-IR score
5 markers

Metabolic health

Evaluates energy processing with glucose, HbA1c, insulin, and related biomarkers.
Magnesium
1 marker

Vitamins & minerals

Analyzes essential nutrients that support immunity, energy, and overall wellbeing.
Creatine Kinase
1 marker

Muscle strength

Assesses biomarkers related to muscle performance, function, and recovery.
Biological Age
1 marker

Biological age

A reflection of how your body is aging at the cellular level, linked to age risks and longevity.
How it works

Get a clearer picture of your health and weight

01

Schedule your test

Visit one of 4,000 collection centres across Australia at your earliest convenience and take one blood draw
02

Get your results

Review your 50+ biomarkers in the Vively app and get a full breakdown, including your Biological Age and Speed of Ageing.
03

Take control of your health

Track and improve your health through the app, with expert 1:1 support available with dietitian coaches to guide healthy changes
FAQ

Got Questions? We’ve Got Answers

What's included in the blood test?
How is this different from getting a blood test at my GP?
What is the Vively membership?
Why do you test these specific biomarkers?
What happens to my data?