Red cell distribution width (RDW) Blood Test: What Low, High and Optimal Red cell distribution width (RDW) Levels Mean.
Red cell distribution width (RDW) measures the variation in red blood cell size, expressed as a percentage (%). Uniform cell size supports efficient oxygen transport and stable energy production, while higher RDW can signal nutrient or metabolic imbalances.
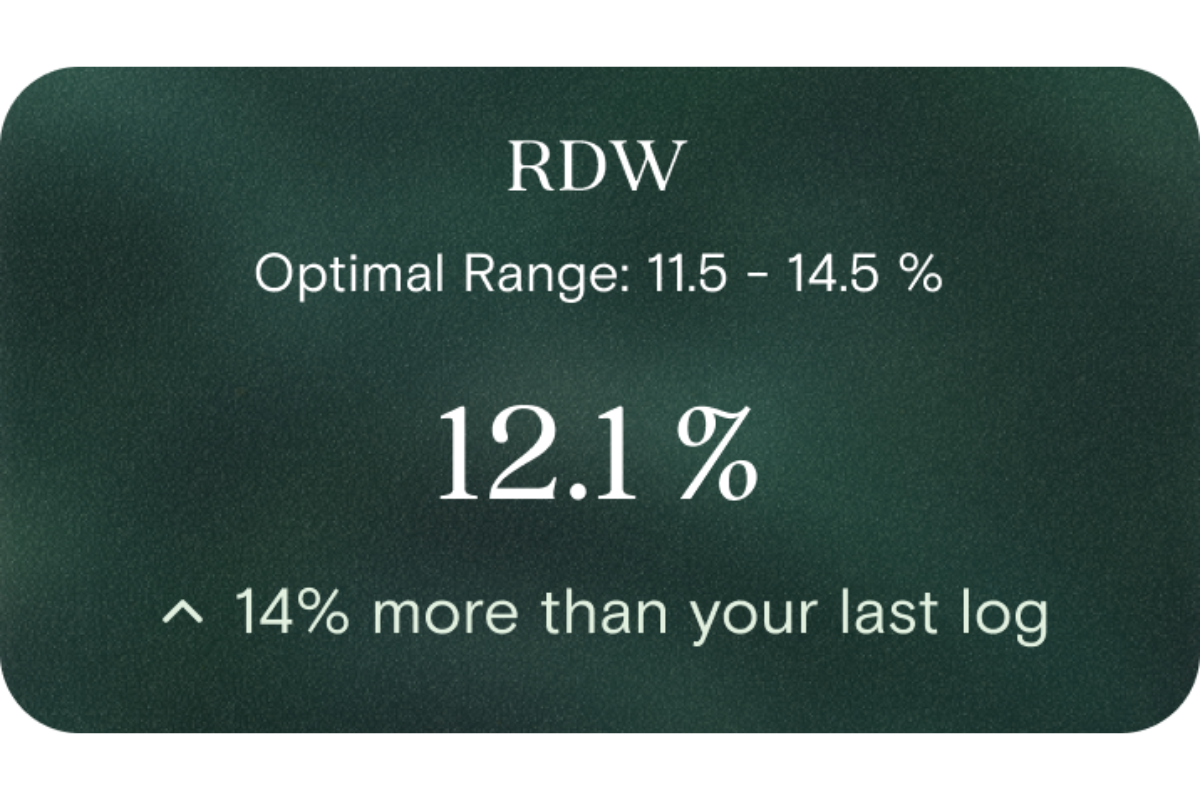
Tracking RDW helps you spot early changes in cellular health and resilience. Keeping levels within the optimal 11.5–14.5% range supports consistent energy, recovery, and long-term wellbeing.
Check Red cell distribution width (RDW) and 70+ markers with Vively's Baseline Health Check - only $99 today.
RDW is a laboratory metric that quantifies how much variation there is in the sizes of your red blood cells, expressed as a percentage. It is calculated as the coefficient of variation of red blood cell volume. A lower RDW means your red blood cells are more uniform in size, whereas a higher RDW shows greater heterogeneity.
Why does it matter for long-term health and wellbeing?
While RDW historically has been used to help diagnose types of anaemia, more recent research shows that higher RDW values — even within “normal” laboratory limits — are independently associated with poorer long-term outcomes in population studies.
Because RDW can reflect nutrient status, inflammation or oxidative stress, it offers a broad lens into changes in your system before they manifest more overtly. For someone pursuing optimal energy, metabolic health and longevity, RDW is an early warning gauge — giving you chance to act, refine and optimise your internal milieu.
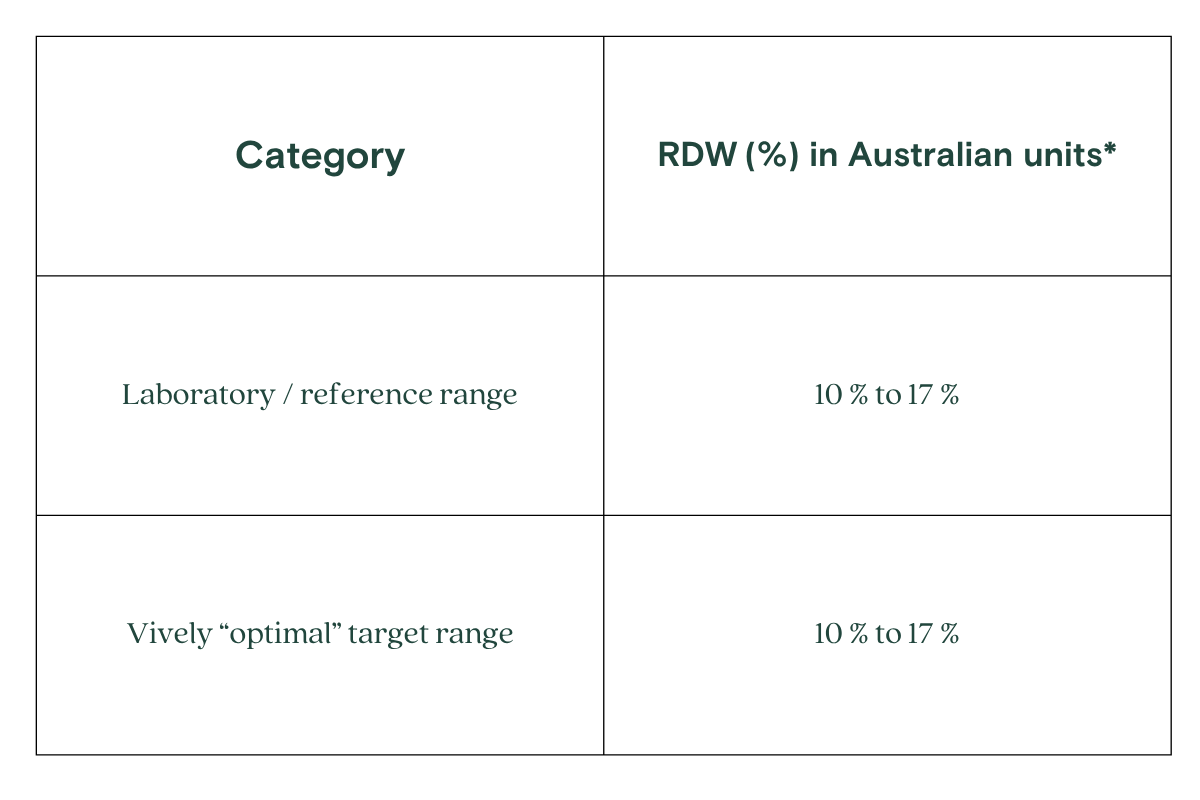
What’s an optimal level of RDW?
* These ranges reflect typical Australian lab units (percentage). Your lab may report slightly different cut-offs, so always check the reference they provide.
What influences RDW levels?
Several lifestyle and internal factors may drive RDW shifts, including:
Nutrient status (particularly iron, vitamin B12, folate)
Low-grade chronic inflammation or oxidative stress
Red blood cell turnover or production dynamics
Subtle metabolic dysfunction or stress burden
Hydration, hormonal fluctuations or metabolic shifts
Because RDW is integrative, changes may reflect a combination of influences rather than a single cause.
What does it mean if RDW is outside the optimal range?
A value above the optimal band (but still within lab “normal”) suggests increased heterogeneity in red blood cell size. In practical terms, that might indicate your body is under mild stress — for example, a nutrient mismatch, subtle inflammation or oxidative strain — that could, over time, erode metabolic resilience or energy capacity. A value below the optimal band (rare) could suggest overly uniform red cell size, which in some rare instances might warrant review of bone marrow or nutritional factors. Either way, the signal is an opportunity to explore contributing lifestyle or nutritional inputs, rather than a diagnosis.
How can I support healthy RDW levels?
Supporting RDW means nurturing red blood cell health and reducing systemic stress. Practical steps include:
Optimising intake of key nutrients (iron, B-vitamins, folate) via diet or guided supplementation
Focusing on anti-inflammatory eating patterns and antioxidants
Ensuring good sleep, stress resilience and physical activity
Minimising exposure to oxidative burden (e.g. tobacco, excess environmental toxins)
Monitoring hydration, hormone balance and metabolic markers
Periodic retesting to observe trends and guide incremental adjustments
This information is provided for general health and wellness purposes only and does not replace medical advice.
References
Skjelbakken, T., et al. (2014). Red cell distribution width is associated with incident myocardial infarction in a general population: The Tromsø Study. Journal of the American Heart Association.
Fava, C., et al. (2019). The role of red blood cell distribution width (RDW) in risk stratification. Annals of Translational Medicine.
Ichinose, J., et al. (2016). Prognostic significance of red cell distribution width in elderly patients. Journal of Thoracic Disease.
Wang, N. J., et al. (2023). The association between red cell distribution width and mortality. PMC.
Red cell distribution width (RDW)
Ready to understand your [marker name] in context?
Vively's Baseline Health Check reviews [marker name] alongside iron studies, full blood count, inflammation, liver health, metabolic markers and 70+ other biomarkers, then turns your results into a personalised plan. Start My Baseline Health Check
70+ biomarkers analysed, each one tells you something specific about how your body is functioning right now, not just whether you're "sick" or "not sick"
Understand markers linked to healthy aging
A reflection of how your body is aging at the cellular level, linked to age risks and longevity.
Biological Age
Speed of Aging
Understand how your body regulates energy
Review glucose, insulin and lipid markers associated with metabolic balance.
Fasting Glucose
Fasting Insulin
Haemoglobin A1c (HbA1c) IFCC mmol/m
Haemoglobin A1c (HbA1c) NGSP/DCCT %
HOMA-IR
Uric Acid/HDL-C (UHR)
TyG index
Sodium/Potassium Ratio
hs-CRP / HDL Ratio
See how your blood supports oxygen and energy
Key blood indicators like hemoglobin, inflammation, and oxygen transport for overall health.
Mean Cell Volume (MCV)
Red Blood Cell (RBC) Count
Haemoglobin
Haematocrit
Red cell distribution width (RDW)
Mean Cell Haemoglobin (MCH)
Mean Cell Haemoglobin Concentration (MCHC)
Platelet count
Review advanced cardiovascular risk markers
Analyse lipid balance and related markers linked to long-term heart and vascular wellbeing.
Your GP isn't the problem. The current health system isn't built for optimal health.
Vively
Standard GP check
Markers analysed
70+ markers
10-15 markers
Optimal ranges included
Biological age
Results reviewed with on-demand practitioner support
Personalised plan built around your results
Ongoing retesting and health trends reporting
How it works
Just 3 simple steps to get started
If needed, we'll recommend further testing to investigate potential issues based on your results
01
Take the test
One simple test to understand where your health stands. Visit one of 4,000 collection centres across Australia at your earliest convenience and take one easy blood draw.
02
Review your results
Meet with a registered health professional to identify what looks fine, what’s worth watching, and what (if anything) needs attention. If nothing needs changing, we’ll tell you that too.
03
Stay confident as life changes
After your baseline, Vively continues as ongoing guidance — helping you stay on track, adjust when something changes, and re-test every 3 months to see progress over time.
Vively is a general wellness platform and does not provide medical advice, diagnosis, or treatment. Any information, insights or guidance offered through our app, website, programs, or coaches is for educational and informational purposes only and should not be considered a substitute for professional medical advice or care. Always consult a qualified healthcare provider before making any health-related decisions.
We acknowledge the Traditional Custodians of the lands where we live and work, the Gadigal of the Eora Nation. We pay our respects to their Elders past and present.


.png)

.svg)

