Wearables

Sleep efficiency

Sleep efficiency measures how much of your time in bed is spent actually sleeping, expressed as a percentage. For example, sleeping seven hours out of eight in bed equals 87.5% efficiency, reflecting how effectively you turn rest time into restorative sleep.

Tracking this metric helps you understand how habits, stress, and environment affect recovery. Maintaining high sleep efficiency supports energy, focus, and long-term wellbeing.

Sleep Efficiency is available in our Continuous Glucose Monitoring program. Order your Vively CGM now for as low as $199.
Book My TestOrder My CGM

What is Sleep Efficiency?

Sleep efficiency measures how effectively you sleep during the time you spend in bed. It’s expressed as a percentage and calculated by dividing total sleep time by total time in bed, then multiplying by 100. Higher percentages mean most of your in-bed time is spent asleep, while lower percentages indicate more wakefulness.

Why does it matter for long-term health and wellbeing?

Efficient sleep supports energy regulation, focus, hormonal balance, and cellular recovery. When your sleep is consolidated — meaning you fall asleep quickly and stay asleep — your body can better restore physical and cognitive systems. Over time, strong sleep efficiency contributes to improved vitality, mental clarity, and overall performance in daily life.

What’s an optimal level of Sleep Efficiency?

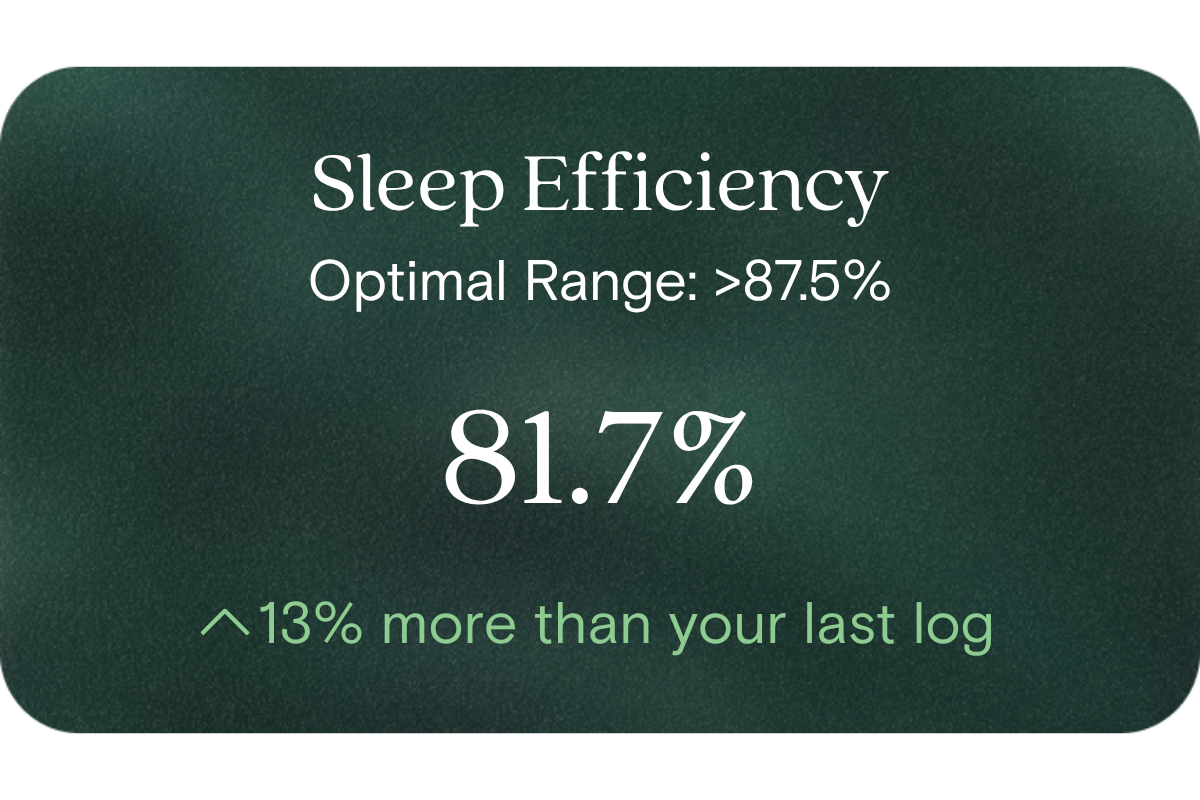
For most adults, a sleep efficiency above 87.5% is considered optimal. This reflects high-quality, consolidated rest.

Typical Australian reference range:

  • < 50% Very low
  • 50–60% Low
  • 61–75% Moderate
  • 76–87.5% Good
  • 87.5% Optimal

What influences Sleep Efficiency levels?

Many factors affect how efficiently you sleep, including:

  • Consistency of sleep and wake times
  • Stress and emotional state
  • Room temperature, lighting, and noise
  • Caffeine or alcohol intake before bed
  • Screen exposure in the evening
  • Physical activity during the day
  • Sleep environment comfort and routine habits

What does it mean if Sleep Efficiency is outside the optimal range?

If your sleep efficiency is lower than 87.5%, it suggests you’re spending a significant amount of time awake while in bed. This doesn’t necessarily indicate a health problem but may reflect lifestyle or environmental factors affecting your rest. Consistently high efficiency, on the other hand, suggests your current routine supports good-quality sleep and recovery.

How can I support healthy Sleep Efficiency levels?

  • Keep a regular bedtime and wake-up schedule.
  • Create a dark, cool, and quiet sleep environment.
  • Avoid caffeine and alcohol within 6 hours of bedtime.
  • Limit screen time and bright light exposure before sleep.
  • Practise a relaxing pre-sleep routine such as light stretching or meditation.
  • Get regular daylight exposure during the day to support your natural rhythm.

This information is provided for general health and wellness purposes only and does not replace medical advice.

References

  1. Ikeda, Y., et al. (2022). Relationships between sleep efficiency and lifestyle factors. PMC.
  2. Desjardins, S., et al. (2019). Factors involved in sleep efficiency: a population-based study. Sleep (Actigraphy)
  3. Sleep Health in Australia’s Federal Parliament House Report (2019). Sleep in Parliament Report, Sleep Health Foundation.
  4. The Impact of Lifestyle Factors on Sleep Efficiency and Sleep Quality. (2023). HSET / Sleep Efficiency Study.
Comprehensive test

Discover 50+ biomarkers
that shape your health

Take the test
Biological Age
1 marker

Biological age

A reflection of how your body is aging at the cellular level, linked to age risks and longevity.
Red Blood Cell (RBC) Count
Haemoglobin
Haematocrit
Mean Cell Volume (MCV)
Mean Cell Haemoglobin (MCH)
Mean Cell Haemoglobin Concentration (MCHC)
Red Cell Distribution Width (RDW)
Platelet Count
8 markers

Blood health

Key blood indicators like hemoglobin, inflammation, and oxygen transport for overall health.
Cholesterol Ratio
HDL Cholesterol
LDL Cholesterol
Non-HDL Cholesterol
Total Cholesterol
Triglycerides
6 markers

Heart health

Assesses cardiovascular health through cholesterol, lipids, and heart-related risk markers.
Cortisol
Dehydroepiandrosterone Sulfate (DHEA-S)
Free Thyroxine (T4)
Free Triiodothyronine (T3)
Thyroid stimulating hormone (TSH)
5 markers

Hormone balance

Evaluates hormone levels that impact energy, sleep, mood, and metabolism.
White Blood Cell (WBC) Count
Neutrophils
Lymphocytes
Monocytes
Eosinophils
Basophils
6 markers

Immune system

Measures immune activity and inflammatory responses to assess body defenses.
High-Sensitivity C-Reactive Protein (hs-CRP)
1 marker

Inflammation status

Tracks signs of chronic or acute inflammation that may affect long-term disease risk.
Bicarbonate
Chloride
Creatinine
Potassium
Sodium
Urea
Uric acid
Anion Gap
Estimated Glomerular Filtration Rate (EGFR)
9 markers

Kidney function

Assesses kidney health through creatinine and other markers of blood filtration.
Alanine Aminotransferase
Albumin
Alkaline Phosphatase
Aspartate aminotransferase (AST)
Bilirubin
Gamma-glutamyl Transferase (GGT)
Globulin
Total Protein
8 markers

Liver health

Measures liver enzymes and proteins responsible for detoxification and metabolic health.
Fasting Glucose
Fasting Insulin
Haemoglobin A1c (HbA1c) IFCC mmol/m
Haemoglobin A1c (HbA1c) NGSP/DCCT %
HOMA-IR score
5 markers

Metabolic health

Evaluates energy processing with glucose, HbA1c, insulin, and related biomarkers.
Magnesium
1 marker

Vitamins & minerals

Analyzes essential nutrients that support immunity, energy, and overall wellbeing.
Creatine Kinase
1 marker

Muscle strength

Assesses biomarkers related to muscle performance, function, and recovery.
Biological Age
1 marker

Biological age

A reflection of how your body is aging at the cellular level, linked to age risks and longevity.
How it works

Get a clearer picture of your health and weight

01

Schedule your test

Visit one of 4,000 collection centres across Australia at your earliest convenience and take one blood draw
02

Get your results

Review your 50+ biomarkers in the Vively app and get a full breakdown, including your Biological Age and Speed of Ageing.
03

Take control of your health

Track and improve your health through the app, with expert 1:1 support available with dietitian coaches to guide healthy changes
FAQ

Got Questions? We’ve Got Answers

What's included in the blood test?
How is this different from getting a blood test at my GP?
What is the Vively membership?
Why do you test these specific biomarkers?
What happens to my data?