Blood Testing

Transferrin Iron Binding Capacity (TIBC)

TIBC, measured in µmol/L, reflects the blood's capacity to transport iron via transferrin, the body's primary iron-carrying protein. Because TIBC shifts with iron stores and inflammation, results are most useful when viewed alongside ferritin, serum iron, and transferrin saturation

Book My Test
Book My Test
Instant pathology referral | 4,000+ Testing Locations in AU | Results in 2-3 days
Order My CGM

What is Transferrin Iron Binding Capacity (TIBC)?

TIBC measures the blood's total capacity to bind and transport iron using transferrin, a protein produced by the liver. When iron stores are low, the liver produces more transferrin to capture as much circulating iron as possible, raising TIBC. When iron stores are adequate or elevated, TIBC tends to fall. It is typically measured as part of a full iron studies panel alongside serum iron, ferritin, and transferrin saturation.

Why does it matter for long-term health and wellbeing?

Iron transport is fundamental to oxygen delivery, energy production, and cellular repair. TIBC provides a complementary picture to ferritin. While ferritin reflects stored iron, TIBC reflects the body's active demand for more. A high TIBC alongside low ferritin and serum iron strongly suggests iron deficiency, even before anaemia develops. Conversely, a low TIBC may point to iron overload, chronic inflammation, or liver dysfunction. Monitoring TIBC as part of a broader iron studies panel supports early identification of imbalances that can affect cognition, endurance, and long-term wellbeing.

What's an optimal level of TIBC?

  • Laboratory reference: 45 to 80 µmol/L
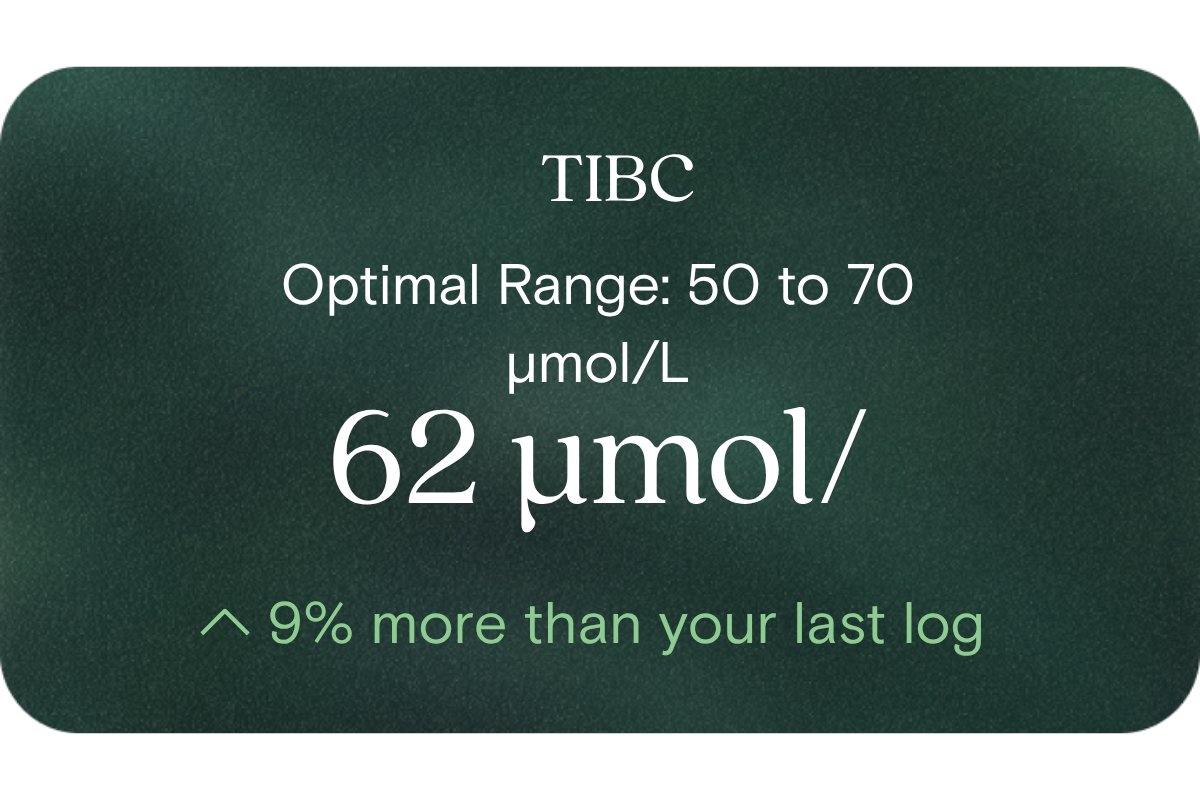
  • Optimal (as per your framework): 50 to 70 µmol/L
  • Note: Australian pathology labs typically interpret TIBC in conjunction with serum iron and transferrin saturation rather than in isolation.

What influences TIBC levels?

  • Iron stores (low iron raises TIBC; high iron or overload suppresses it)
  • Inflammation or chronic disease (tends to lower TIBC independent of iron status)
  • Liver function (the liver produces transferrin, so hepatic conditions can affect TIBC)
  • Nutritional status (protein deficiency and malnutrition can reduce transferrin production)
  • Pregnancy (TIBC typically rises in pregnancy due to increased iron demand)
  • Genetic conditions affecting iron metabolism, such as hereditary haemochromatosis

What does it mean if TIBC is outside the optimal range?

  • Above optimal / high TIBC: Often indicates iron deficiency, as the body upregulates transferrin to capture more circulating iron. Most meaningful when accompanied by low ferritin and low transferrin saturation.
  • Below optimal / low TIBC: May suggest iron overload, chronic inflammatory conditions, liver disease, or malnutrition. Low TIBC in the context of elevated ferritin warrants further clinical review.

How to support healthy TIBC levels?

  • Address underlying iron deficiency through dietary sources (lean red meat, legumes, leafy greens) combined with vitamin C to enhance absorption
  • Manage systemic inflammation through sleep, stress reduction, and an anti-inflammatory diet, as chronic inflammation independently suppresses TIBC
  • Support liver health through limiting alcohol, maintaining a healthy weight, and eating a nutrient-dense diet
  • Retest TIBC alongside serum iron, ferritin, and transferrin saturation to build a complete picture of iron status
  • Consult a healthcare practitioner before supplementing iron, as supplementation without confirmed deficiency can cause harm

This information is provided for general health and wellness purposes only and does not replace medical advice.

References

  1. Royal College of Pathologists of Australasia. (2021). Iron Studies – Standardised Reporting Protocol (Second Edition). Surry Hills, NSW: Surry Hills, NSW: RCPA.
  2. Camaschella, C. (2015). Iron-deficiency anaemia. New England Journal of Medicine, 372(19), 1832–1843.
  3. Worwood, M. (2007). Indicators of the iron status of populations: ferritin. In Assessing the Iron Status of Populations (2nd ed.). World Health Organization.
  4. Trinder, D., Fox, C., Vautier, G., & Olynyk, J. K. (2002). Molecular pathogenesis of iron overload. Gut, 51(2), 290–295.
Full Body Health Check

Discover 80+ biomarkers
that shape your health

Take the test
Biological Age
1 marker

Biological age

A reflection of how your body is aging at the cellular level, linked to age risks and longevity.
Red Blood Cell (RBC) Count
Haemoglobin
Haematocrit
Mean Cell Volume (MCV)
Mean Cell Haemoglobin (MCH)
Mean Cell Haemoglobin Concentration (MCHC)
Red Cell Distribution Width (RDW)
Platelet Count
8 markers

Blood health

Key blood indicators like hemoglobin, inflammation, and oxygen transport for overall health.
Cholesterol Ratio
HDL Cholesterol
LDL Cholesterol
Non-HDL Cholesterol
Total Cholesterol
Triglycerides
6 markers

Heart health

Assesses cardiovascular health through cholesterol, lipids, and heart-related risk markers.
Cortisol
Dehydroepiandrosterone Sulfate (DHEA-S)
Free Thyroxine (T4)
Free Triiodothyronine (T3)
Thyroid stimulating hormone (TSH)
5 markers

Hormone balance

Evaluates hormone levels that impact energy, sleep, mood, and metabolism.
White Blood Cell (WBC) Count
Neutrophils
Lymphocytes
Monocytes
Eosinophils
Basophils
6 markers

Immune system

Measures immune activity and inflammatory responses to assess body defenses.
High-Sensitivity C-Reactive Protein (hs-CRP)
1 marker

Inflammation status

Tracks signs of chronic or acute inflammation that may affect long-term disease risk.
Bicarbonate
Chloride
Creatinine
Potassium
Sodium
Urea
Uric acid
Anion Gap
Estimated Glomerular Filtration Rate (EGFR)
9 markers

Kidney function

Assesses kidney health through creatinine and other markers of blood filtration.
Alanine Aminotransferase
Albumin
Alkaline Phosphatase
Aspartate aminotransferase (AST)
Bilirubin
Gamma-glutamyl Transferase (GGT)
Globulin
Total Protein
8 markers

Liver health

Measures liver enzymes and proteins responsible for detoxification and metabolic health.
Fasting Glucose
Fasting Insulin
Haemoglobin A1c (HbA1c) IFCC mmol/m
Haemoglobin A1c (HbA1c) NGSP/DCCT %
HOMA-IR score
5 markers

Metabolic health

Evaluates energy processing with glucose, HbA1c, insulin, and related biomarkers.
Magnesium
1 marker

Vitamins & minerals

Analyzes essential nutrients that support immunity, energy, and overall wellbeing.
Creatine Kinase
1 marker

Muscle strength

Assesses biomarkers related to muscle performance, function, and recovery.
Biological Age
1 marker

Biological age

A reflection of how your body is aging at the cellular level, linked to age risks and longevity.
How it works

Get a clearer picture of your health today

01

Schedule your test

Visit one of 4,000 collection centres across Australia at your earliest convenience and take one blood draw
02

Get your results

Review your 80+ biomarkers in the Vively app and get a full breakdown, including your Biological Age and Speed of Ageing.
03

Take control of your health

Track and improve your health through the app, with expert 1:1 support available with dietitian coaches to guide healthy changes
FAQ

Got Questions? We’ve Got Answers

What's included in the blood test?
How is this different from getting a blood test at my GP?
What is the Vively membership?
Why do you test these specific biomarkers?
What happens to my data?