Uric Acid / HDL-C (UHR) is a calculated ratio from a lipid and metabolic blood panel, comparing uric acid to HDL cholesterol ((uric acid ÷ HDL-C) × 100). Uric Acid / HDL-C (UHR) levels help flag cardiometabolic strain: higher ratios can suggest insulin resistance, metabolic syndrome, inflammation or oxidative stress, and may align with fatty liver risk or reduced HDL function; lower ratios generally indicate more favourable lipid metabolism. This matters for cardiovascular health, energy regulation and recovery. Because UHR is derived from two markers, it is best read alongside uric acid, HDL-C, triglycerides, LDL-C, fasting glucose or HbA1c, and inflammation markers to clarify the drivers—testing is the most direct way to do that.
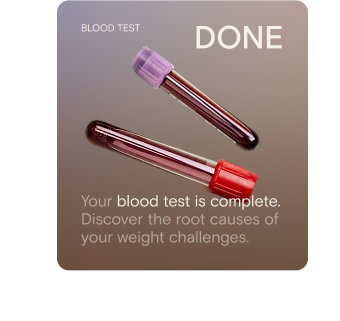
UHR is now available in Vively's baseline health test, along with 60+ important health markers. Book your test today for only $99.
UHR is the value you obtain when you divide your blood uric acid concentration (in mg/dL) by your HDL-cholesterol (in mg/dL), then multiply by 100 to express as a percentage. It integrates two related but distinct measurements—one representing purine turnover/oxidative stress (UA), the other reflecting lipid transport and protective cholesterol function (HDL-C).
Why does UHR matter for long-term health and wellbeing?
While this isn’t a test for diagnosing disease, UHR offers insight into underlying processes of metabolic and inflammatory stress. A higher UHR suggests that uric acid is relatively elevated and/or HDL-C is relatively low, which may reflect patterns of oxidative damage, endothelial (blood-vessel lining) stress, insulin resistance and fat-metabolism strain. Several recent studies show that UHR correlates with metabolic-syndrome features, fatty-liver indicators, and elevated mortality in broad populations.
From a performance and longevity mindset: keeping UHR at the lower end supports your body’s ability to recover, manage energy effectively, maintain vascular vitality and promote robust metabolic flexibility.
What’s an optimal level of UHR?
As of now, no universally agreed “gold-standard” optimal range exists for UHR in the general (Australian) healthy population. However, here’s a summary of current evidence and practical guiding ranges:
* These are guidance only, not clinical thresholds. Always consider your full profile and context.
What influences UHR levels?
Key levers for UHR include:
Uric acid-raising factors: high purine or fructose intake, low hydration, excess alcohol, rapid cell turnover, and compromised renal excretion.
HDL-C-lowering factors: sedentary lifestyle, excess body fat (particularly visceral fat), low-quality fats in diet, smoking, poor sleep, and chronic stress.
Combined metabolic stress: insulin resistance, excess visceral fat, inflammation and oxidative load may elevate UA, reduce HDL-C and raise the ratio. Research shows UHR correlates with markers of fat accumulation and insulin resistance.
What does it mean if UHR is outside the optimal range?
If your UHR is trending higher than your earlier readings or above the guidance target (e.g., ~10 % or more), it suggests that your metabolic-inflammatory balance may be under strain. It might indicate that your uric acid load is relatively high and/or your HDL-C buffering capacity is reduced.
From a proactive-health vantage point this is a “signal” to review your habits (nutrition, recovery, movement, hydration, alcohol intake) rather than a diagnostic alert. The key is tracking changes over time and using the ratio as a feedback loop for lifestyle optimisation.
How can I support healthy UHR levels?
Here are practical lifestyle strategies aligned with Vively’s performance and longevity-oriented approach:
Maintain a diet rich in whole, minimally processed foods, emphasising plant fibre, moderate quality proteins and limiting high-fructose/sugar-sweetened and highly-processed foods (which can raise UA).
Stay well hydrated and moderate alcohol intake.
Increase regular physical activity—including strength training and cardiovascular work—to support HDL-C levels and metabolic flexibility.
Focus on healthy body composition and keep visceral fat in check via motion, nutrition and recovery.
Prioritise sleep quality and stress management: chronic poor sleep and stress may lower HDL-C and increase oxidative load.
Consider regular monitoring of your UA and HDL-C (and thus UHR) so that you can see how changes in lifestyle affect the ratio over time.
This information is provided for general health and wellness purposes only and does not replace medical advice.
References
Ahari, R.K., Sahranavard, T., Mansoori, A., Fallahi, Z., Babaeepoor, N., Ferns, G., et al. (2023). Serum uric acid to high-density lipoprotein ratio as a novel inflammatory and metabolic marker. PMC.
Lai, X., Chen, T. (2024). Association of serum uric acid to high-density lipoprotein cholesterol ratio with all-cause and cardiovascular mortality in patients with diabetes or prediabetes: a prospective cohort study. Front Endocrinol.
Bazmandegan, G., et al. (2024). Uric acid to HDL ratio: A marker for predicting incidence of metabolic syndrome in patients with type II diabetes. Nutr Metab Cardiovasc Dis.
Li, Z., Liu, Q., Yao, Z. (2024). The serum uric acid-to-high-density lipoprotein cholesterol ratio is a predictor for all-cause and cardiovascular disease mortality: a cross-sectional study. Front Endocrinol.
Huang, X., Hu, L., Li, J., et al. (2024). U-shaped association of uric acid to HDL cholesterol ratio (UHR) with all-cause and cardiovascular mortality in diabetic patients: NHANES 1999–2018. BMC Cardiovasc Disord.
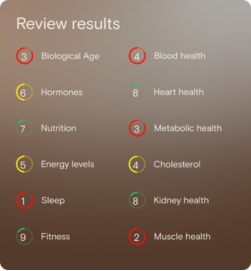
The blood test includes a breakdown of over 80 blood markers across hormones, heart, metabolism, liver and blood health, and also includes your Biological Age, which is a researched-backed analysis of your biological rate of aging, and indication of how well your body is aging. You will also receive personalised recommendations across nutrition, movement, sleep, stress and mindset, as well as resources to learn and develop knowledge in your body and health.
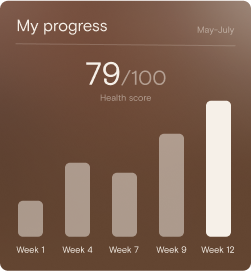
Vively includes 3x more lab tests than most GP check-ups, giving you a much more in-depth understanding of your health and wellbeing. Vively also tracks your results over time and brings you actionable insights based on your specific results. All lab tests come with a personalised protocol and action plan to improve your weight and long-term health.
The Vively membership contains everything you need to achieve your health goals:
- Access to your custom health protocol in the Vively app - Access to our support team at any time during business hours - Tools to help you build long-term habits & track health improvements - Access to Continuous Glucose Monitors to optimise your blood sugar levels - Book in follow up blood tests whenever you need
We test over 50 biomarkers across your blood, hormones, metabolism, liver, kidneys, cholesterol, and more. Each one tells us something important about your health. By looking at them together, we can understand the relationship between your weight and your health — and create a plan that’s personalised to you.
Each one was carefully chosen because it helps us answer one or more of these questions: Is your body handling food and energy in a healthy way? Are there hidden factors you wouldn’t know about otherwise? What plan is right for you, and how can we track progress?
At Vively we take our data security very seriously. All of your data is 256 bit SSL/TLS encrypted. Access to your medical records are encrypted with the industry standard AES-256 encryption algorithm to protect your data at all times. You can read more about this in our privacy policy.Only our health professionals and authorised staff will have access to view your medical records. Data can be stored on third party servers, but it’s always encrypted.
Vively is a general wellness platform and does not provide medical advice, diagnosis, or treatment. Any information, insights or guidance offered through our app, website, programs, or coaches is for educational and informational purposes only and should not be considered a substitute for professional medical advice or care. Always consult a qualified healthcare provider before making any health-related decisions.
We acknowledge the Traditional Custodians of the lands where we live and work, the Gadigal of the Eora Nation. We pay our respects to their Elders past and present.


.png)

.svg)

