

On this page
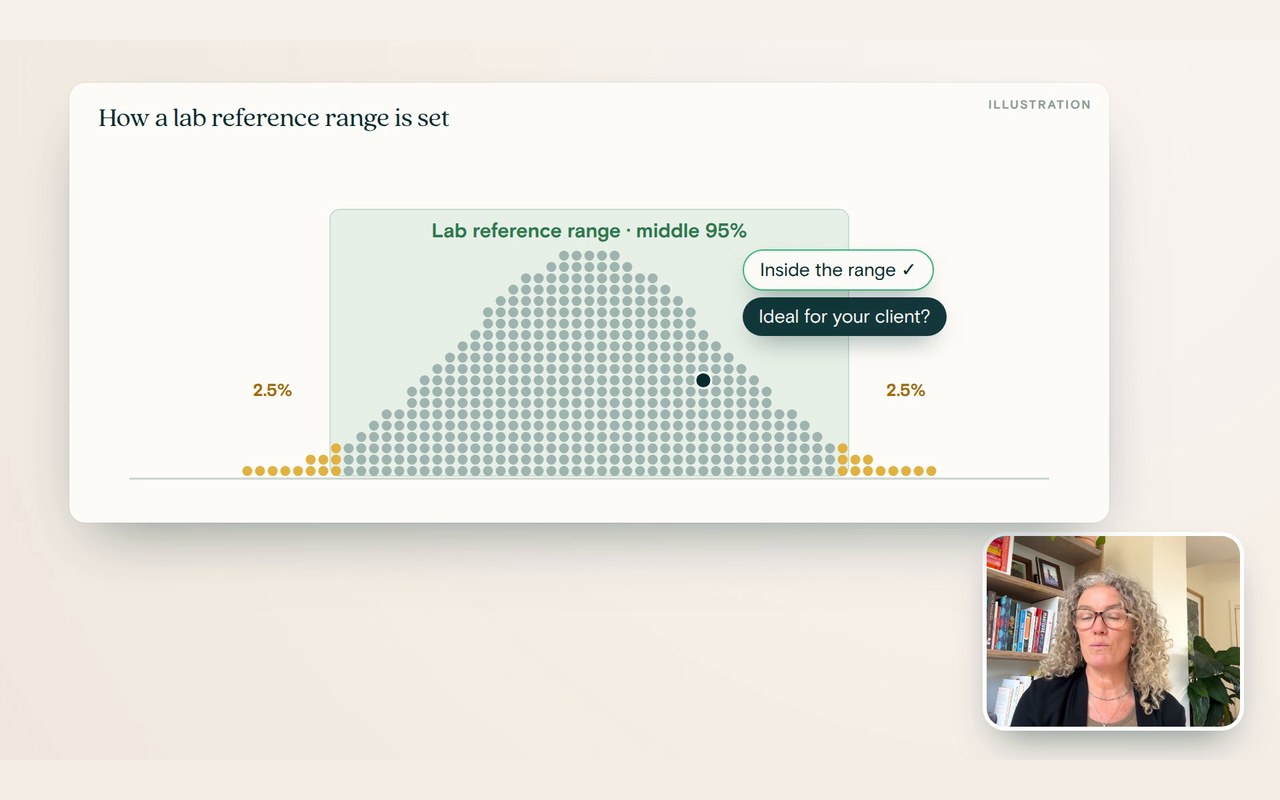
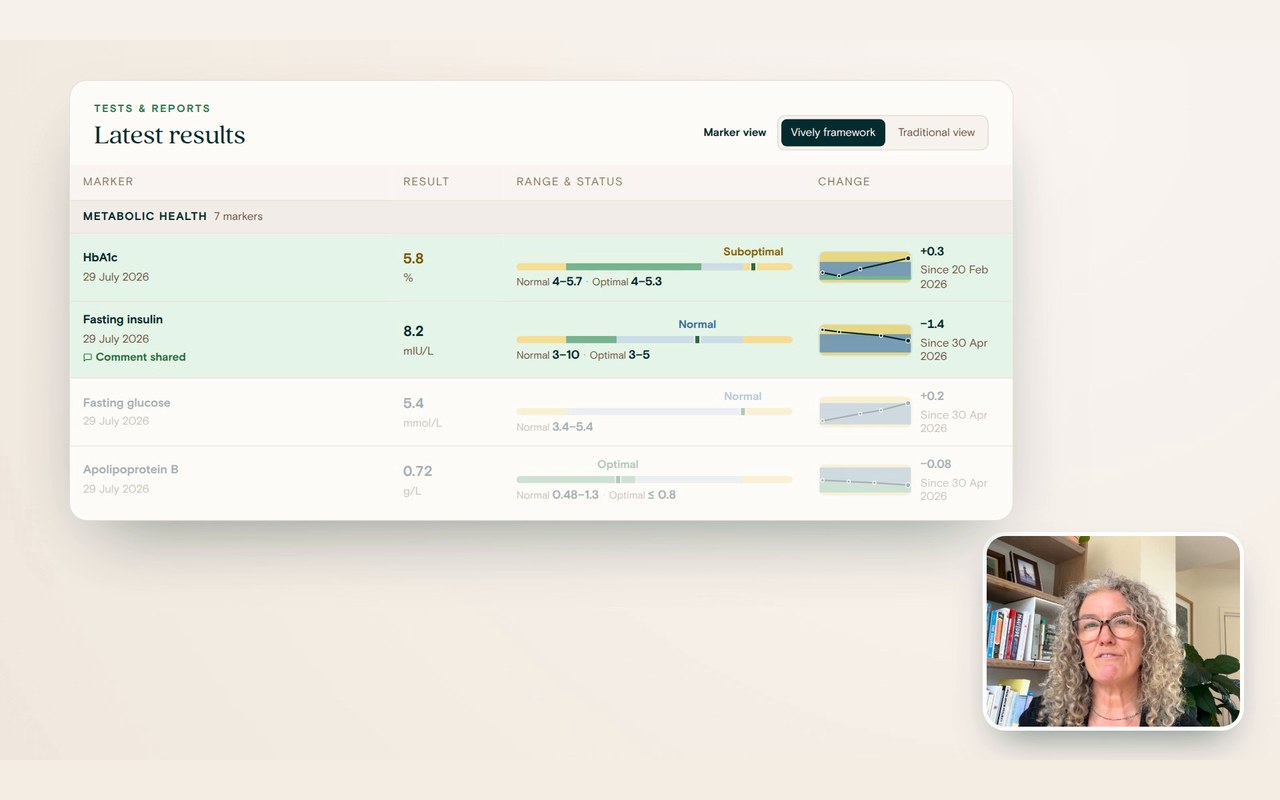
A reference range is the laboratory’s range for the middle 95% of a healthy reference group. It tells you whether a result is unusual. An optimal range is a narrower target linked to better health outcomes in published research. Vively shows both side by side and never replaces the lab’s range.
How labs set reference ranges
Most reference ranges cover the middle 95% of results from a group of healthy people. By design, about 1 in 20 healthy people fall outside the range for any single test. Australian labs share harmonised ranges for many common tests, and each report shows the range the lab used.
A result inside the reference range is common in that population. That isn’t the same as ideal for your client.
What an optimal range adds
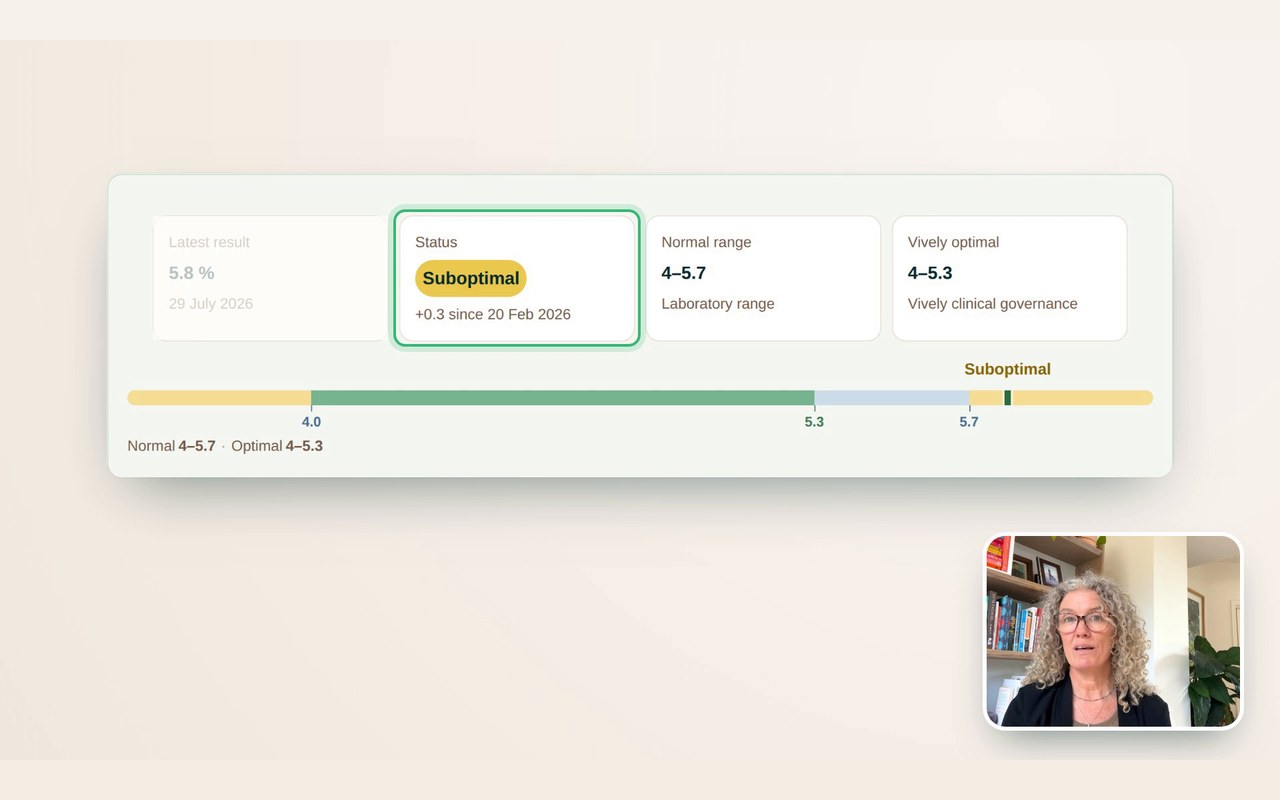
An optimal range narrows the target to where published studies link results with better outcomes. It helps you spot a trend early, like fasting insulin creeping up while glucose still looks normal, and gives your client a clear goal.
When every result looks normal
Picture a client Dr Woolhouse sees all the time. She’s in her late forties, tired, sleeping badly, and her weight has crept up over a few years. Her bloods come back and every result is inside the lab range. On paper, she’s fine. Switch between the two views to see what the optimal range adds.
None of that is a diagnosis. Together, though, the three Normal results show where she may be heading, and they give the two of you something specific to work on now: thyroid function, blood glucose and blood fats.
Examples from the Baseline
| Marker | Typical lab range | Vively optimal range |
|---|---|---|
| Fasting insulin | 3–10 mIU/L | 3–5 mIU/L |
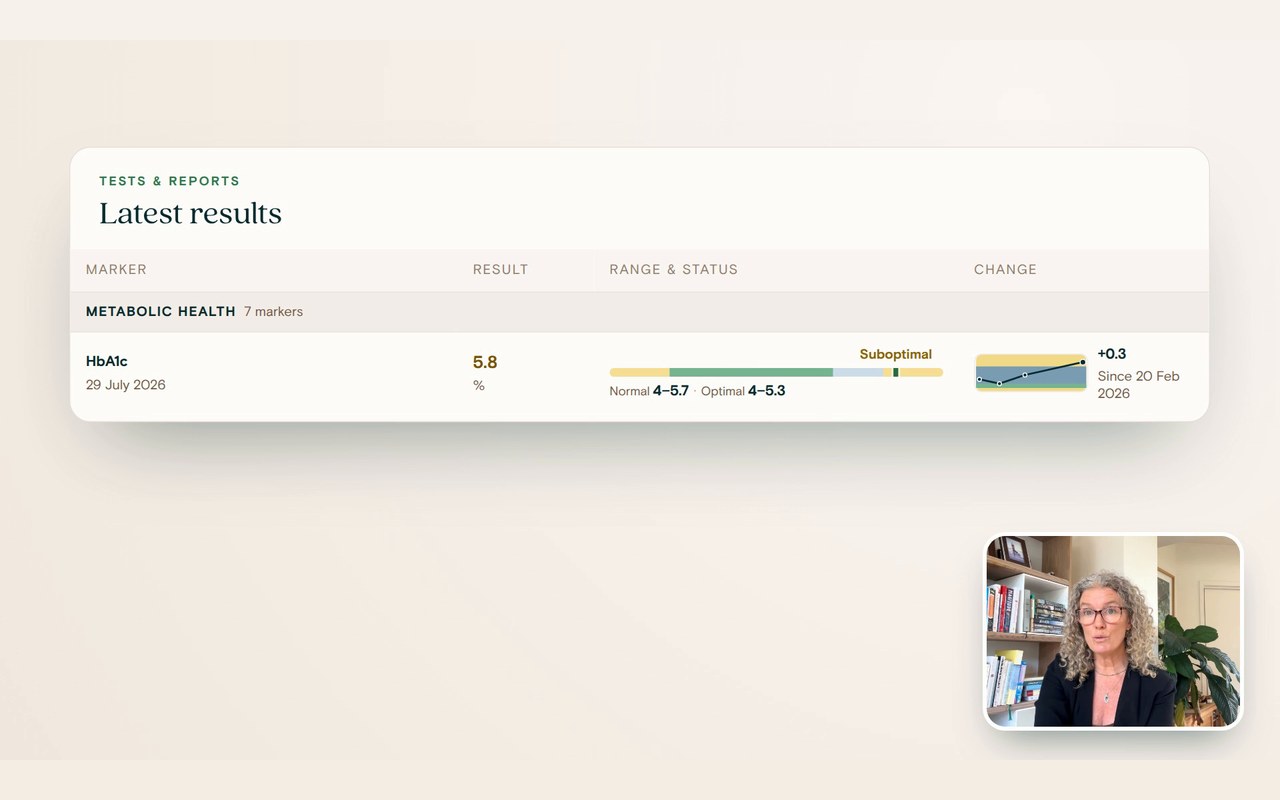
| HbA1c | 4.0–5.7 % | 4.0–5.3 % |
| Vitamin D | 50–200 nmol/L | 120–200 nmol/L |
| TSH | 0.5–4.0 mIU/L | 1.0–2.5 mIU/L |
| Triglycerides | 0.5–2.1 mmol/L | 0.5–1.2 mmol/L |
| LDL cholesterol | 1.7–3.5 mmol/L | 1.5–2.6 mmol/L |
Lab ranges vary by laboratory, age and sex. The platform always shows the range on your client’s own report.
How Vively sets and shows optimal ranges
- 96 markers have a Vively optimal range backed by published evidence
- Each range lists its sources in the platform, so you can check the reasoning
- Where the evidence isn’t strong enough, we show the lab’s range only
- Set your own target for any marker
- The framework was developed under the clinical leadership of Dr Michelle Woolhouse
How the ranges were built
Published research, mostly PubMed-indexed studies, on where results sit when people are well.
Watch →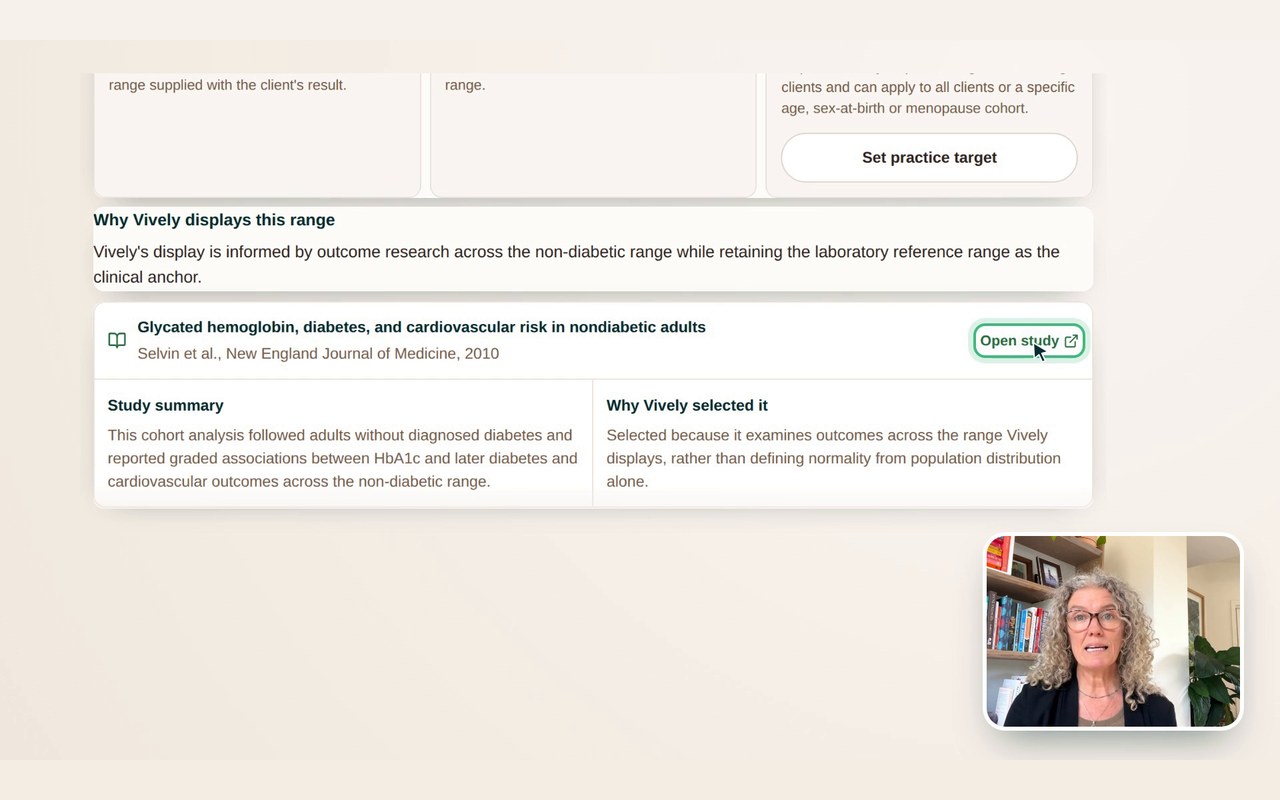
Check the evidence yourself
The range, the reasoning and the studies behind every marker, with links to read them.
Watch →Explaining ranges to your client
Start with the lab range: is anything unusual? Then use the optimal range to set a goal. Keep context in view, such as age, pregnancy, medications and recent illness. An optimal range supports your interpretation. It doesn’t diagnose.
Using both ranges with a client
Check the lab range, set a goal with the optimal range, then retest to see what’s changed.
Watch →
What optimal ranges are not
Not a diagnosis: the lab range stays the anchor, context matters, and you can set your own targets.
Watch →Test yourself: Optimal, Normal or Suboptimal?
Four quick results. Choose the status Vively would show for each one.