Longevity biomarkers: 5 blood tests that track healthy ageing
The longevity biomarkers worth testing in Australia: insulin, HbA1c, ApoB, Lp(a), hs-CRP and biological age, with lab and optimal ranges and Vively member data.


On this page
In short
- The most useful longevity biomarkers are fasting insulin and HbA1c, ApoB and Lp(a), hs-CRP and a biological age score, and each is a simple blood test.
- Vively's optimal ranges are 4.0 to 5.3% for HbA1c and 3 to 5 mIU/L for fasting insulin, and an hs-CRP above 3 mg/L flags higher heart risk.
- Test once for a baseline, then re-test markers that were off after about 3 months, while Lp(a) is mostly inherited and rarely needs repeating.
From Vively member data
57%
Fasting insulin above 5 mIU/L
of 4,579 members with normal HbA1c and fasting glucose
15%
hs-CRP above 3 mg/L
of 5,419 members, rising to 22% of women 50 to 59
15%
Men 50+ biologically older
by PhenoAge, against 6% of women
The most useful longevity biomarkers are the ones that show disease drifting in years before diagnosis: fasting insulin and HbA1c for metabolic health, ApoB and Lp(a) for heart risk, hs-CRP for inflammation, and a biological age score that combines several markers. Each is a simple blood test, and the trend over time tells you more than any single result.
Start with the marker most people already have: HbA1c. Type in yours to see where it sits against Australian cut-offs and our optimal range.
What are longevity biomarkers?
Longevity biomarkers are blood markers that track how fast the processes behind chronic disease are moving, before any disease shows up. Healthspan is the years you live in good health, and most of what shortens it (type 2 diabetes, heart disease, some cancers, dementia) builds slowly over decades.
Standard check-ups are built to catch disease once it crosses a diagnostic line. A longevity view asks a different question: is this marker drifting the wrong way while it is still inside the lab range? That is why we read results against optimal ranges as well as lab ranges, and why a pattern across several tests matters more than one number.
“With 67% of the population are either overweight or obese, and 50% by the age of 50 have at least one chronic disease, our normal reference ranges are based on a potentially abnormal subset of people. Know what is optimal rather than what requires medication.”
Dr Michelle Woolhouse, Vively Medical Director
1. Fasting insulin, HOMA-IR and HbA1c
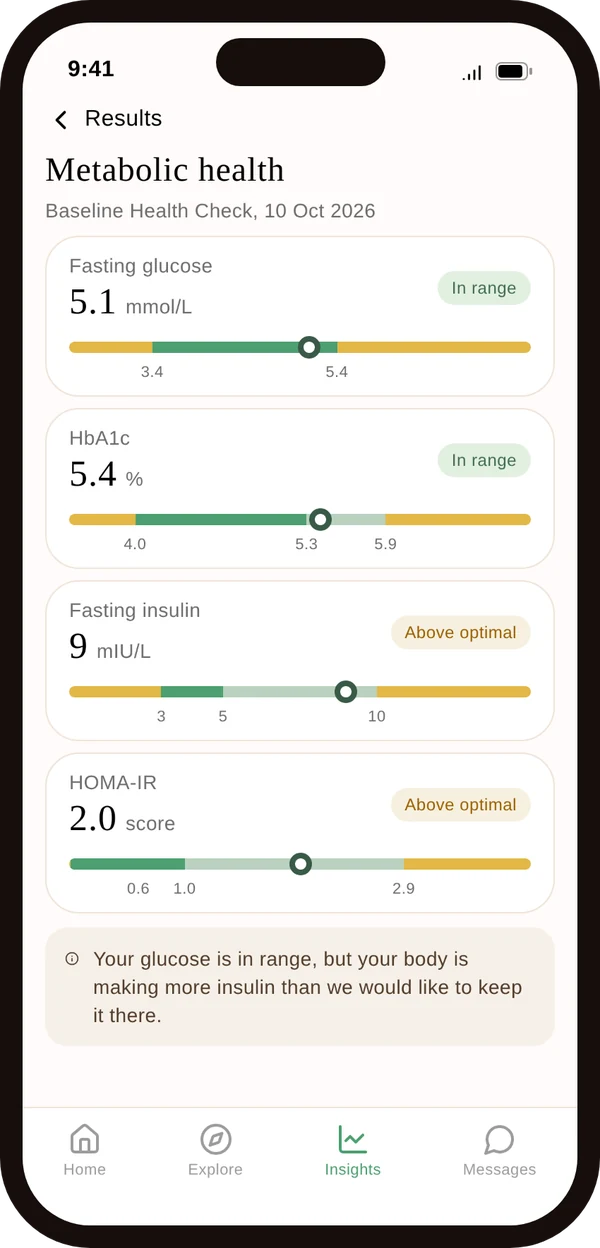
These three show how well your body handles glucose, and fasting insulin is usually the first to move. When cells start to resist insulin, the pancreas makes more of it to keep glucose normal, so glucose and HbA1c can look fine for years while insulin climbs.
“HOMA-IR... a great indicator of insulin resistance which typically occurs around 10-15 yrs prior to diagnosable glucose impairment.”
Dr Michelle Woolhouse, Vively Medical Director
Vively member data shows how common this hidden stage is. Among 4,579 members whose HbA1c and fasting glucose were both normal, 57% had fasting insulin above our optimal range and 66% had a HOMA-IR above 1.0.
- HbA1c: the lab range is about 20 to 41 mmol/mol, and Vively's optimal range is 20 to 34 mmol/mol (4.0 to 5.3%). Australian doctors use 6.5% (48 mmol/mol) or above as the diabetes cut-off, confirmed with a repeat test. Read more about the HbA1c test.
- Fasting insulin: labs usually flag it above about 10 mIU/L. Our optimal range is 3 to 5 mIU/L.
- HOMA-IR: calculated from fasting glucose and insulin, and not printed on most lab reports. Our optimal is 1.0 or below. Work yours out with the HOMA-IR calculator.
2. ApoB, Lp(a) and the lipid panel
ApoB counts the particles that carry cholesterol into artery walls, and it can flag heart risk that a standard LDL result misses. Every LDL, VLDL and remnant particle carries one ApoB molecule, so ApoB is a direct count of the particles that cause plaque.
The ratio of ApoB to ApoA1 (the main protein in HDL) adds more. In the AMORIS study of 175,553 people in Sweden (Walldius and colleagues, 2001), high ApoB and low ApoA1 predicted fatal heart attacks better than cholesterol measures did. Our Medical Director's view is that the ApoB to ApoA1 ratio is useful whether or not someone already has heart disease.
Lp(a) is a cholesterol particle whose level is mostly set by your genes. The European Atherosclerosis Society's 2022 consensus statement links high Lp(a) to heart disease and aortic stenosis even when LDL is low, and recommends that every adult has it measured at least once. Our guide to ApoB and Lp(a) covers both in more depth.
The 2023 Australian guideline for assessing cardiovascular risk recommends a risk check for everyone aged 45 to 79, from 35 for people with diabetes and from 30 for First Nations people. The Aus CVD Risk Calculator it uses does not include ApoB or Lp(a), so treat these as extra detail that your GP reads alongside the calculator, not a replacement for it.
3. hs-CRP for inflammation
High-sensitivity C-reactive protein (hs-CRP) measures low-grade inflammation, which drives plaque in arteries and is linked to insulin resistance. The CDC and American Heart Association statement on inflammation markers (Pearson and colleagues, 2003) groups hs-CRP as under 1 mg/L lower risk, 1 to 3 average and above 3 higher cardiovascular risk.
A single high result needs context. hs-CRP rises after a cold, an injury or a hard training session, and the CDC and AHA statement advises that a result above 10 mg/L points to acute illness and should be repeated once you are well. Our post on chronic inflammation and CRP explains what moves it.
4. Full blood count and kidney and liver markers
Several everyday markers turn out to predict ageing well when they are read together. White cell count, the share of lymphocytes, red cell size (MCV) and red cell distribution width (RDW) come from a full blood count. Albumin, creatinine and alkaline phosphatase come from liver and kidney tests. On their own, small shifts in these mean little. Combined, they form the basis of the biological age score below.
Some of these are calculated or derived values, such as the neutrophil to lymphocyte ratio. They are sensitive to recent illness and need a practitioner to read them in context, so do not draw conclusions from one of them alone.
5. Biological age (PhenoAge)
Biological age turns nine routine blood markers into one number: the age your blood results look like. The method, Phenotypic Age, was developed by Levine and colleagues and tested by Liu and colleagues (2018) in a large US national survey, where a higher score than calendar age predicted higher risk of death and disease. It uses albumin, creatinine, glucose, CRP, lymphocyte percentage, MCV, RDW, alkaline phosphatase and white cell count, plus your age.
In Vively members aged 50 and over, 15% of men had a PhenoAge older than their calendar age, against 6% of women.
Aged 50 and over, 15% of men had a biological age (PhenoAge) above their calendar age, against 6% of women.
See the numbers as a table
| Women | Men | |
|---|---|---|
| 18 to 29 | 9% (n=241) | 12% (n=236) |
| 30 to 39 | 7% (n=897) | 9% (n=596) |
| 40 to 49 | 5% (n=1,074) | 11% (n=656) |
| 50 to 59 | 7% (n=788) | 14% (n=393) |
| 60+ | 5% (n=465) | 16% (n=253) |
Treat biological age as a summary to watch, not a verdict. It moves with the markers inside it, so improving glucose, inflammation and kidney health tends to move it too. Try the biological age calculator with your own results, or read more in what is biological age.
Longevity biomarkers at a glance
| Marker | What it shows | Lab range or cut-off | Vively optimal |
|---|---|---|---|
| HbA1c | Average glucose over 2 to 3 months | About 20 to 41 mmol/mol; diabetes from 48 (6.5%) | 20 to 34 mmol/mol (4.0 to 5.3%) |
| Fasting insulin | How hard your body works to control glucose | Flagged above about 10 mIU/L | 3 to 5 mIU/L |
| HOMA-IR | Insulin resistance, calculated | Not printed on most reports | 1.0 or below |
| ApoB | Number of plaque-forming particles | Set by each lab | Read alongside your other heart risk factors |
| Lp(a) | Inherited cholesterol particle | Set by each lab | Test at least once |
| hs-CRP | Low-grade inflammation | Above 3 mg/L flags higher heart risk | Read with symptoms and recent illness |
| PhenoAge | Biological age from 9 markers | Calculated, not a lab range | At or below your calendar age |
How often should you test?
Test once to get a baseline, then repeat the markers that were off after you have made changes, usually after about three months. HbA1c reflects roughly three months of glucose, so that is the earliest it can show a change. Lp(a) rarely needs repeating because it is mostly inherited.
A single result can be useful. A pattern across several tests is better, and a trend over a few years is better again. Keep tests consistent, in the morning and fasting, so you compare like with like. Any result that is very abnormal, or comes with symptoms such as chest pain, unexplained weight loss or ongoing fatigue, needs your GP rather than a re-test.
What moves longevity biomarkers?
Lifestyle medicine does most of the work for the markers above. Fasting insulin, HOMA-IR, triglycerides and hs-CRP all respond to the same few changes: more fibre and fewer refined carbohydrates, regular movement including strength training, enough sleep, less alcohol, and losing weight around the middle if you carry extra. ApoB responds to less saturated fat and, when needed, medication. Lp(a) does not change much with lifestyle, which is why knowing it early matters: it tells you how hard to work on everything else.
How Vively can help
The Vively Baseline blood test covers 70+ markers, including HbA1c, fasting insulin, HOMA-IR, lipids, hs-CRP, a full blood count and kidney and liver tests, and calculates your biological age. Results arrive in the app within a few days, read against optimal ranges, and a practitioner explains them and helps you plan what to change. Your membership includes a targeted re-test after 3 months. Members can add the Longevity Panel, which measures ApoB, ApoA1, Lp(a) and homocysteine. Blood is taken at one of 3,700+ partner collection centres, with no appointment needed.
The Baseline Health Check measures 70+ markers, including fasting insulin, HbA1c, hs-CRP and your biological age, from one blood draw at one of 3,700+ partner collection centres. Results land in the app within a few days, read against optimal ranges.
Frequently asked questions
What is the best blood test for longevity?
No single test covers it. The most useful combination is fasting insulin, HOMA-IR and HbA1c for metabolic health, ApoB and Lp(a) for heart risk, hs-CRP for inflammation, and a biological age score built from routine markers. Together they show where risk is building years before a diagnosis, while there is still time to act.
What is a good HbA1c for longevity?
Vively's optimal range for HbA1c is 4.0 to 5.3% (20 to 34 mmol/mol). Most Australian labs flag results from 42 mmol/mol (6.0%), and 6.0 to 6.4% is the prediabetes range. An HbA1c of 6.5% (48 mmol/mol) or above is in the diabetes range and is confirmed by a doctor with a repeat test.
Do I need a referral for longevity blood tests in Australia?
Every pathology test in Australia needs a doctor to sign the request. You can get these tests without a referral from your own GP, because a doctor in our network signs off every request. The Baseline lab tests can be Medicare-rebated. The membership is not.
Is biological age testing accurate?
PhenoAge is a validated research measure, not a diagnosis. It was built from routine blood markers and tested in a large US national survey, where a higher score predicted higher risk of death and disease. It is most useful for tracking your own trend over time, and less useful for comparing yourself with one other person.
How often should I test longevity biomarkers?
Test once for a baseline, then re-test the markers that were off after about three months of changes. After that, once or twice a year is enough for most people. Lp(a) usually only needs testing once because it is largely inherited.
Sources
- Nelson MR, et al. 2023 Australian guideline for assessing and managing cardiovascular disease risk. Medical Journal of Australia, 2024.
- Walldius G, et al. High apolipoprotein B, low apolipoprotein A-I, and improvement in the prediction of fatal myocardial infarction (AMORIS study). The Lancet, 2001.
- Kronenberg F, et al. Lipoprotein(a) in atherosclerotic cardiovascular disease and aortic stenosis: a European Atherosclerosis Society consensus statement. European Heart Journal, 2022.
- Pearson TA, et al. Markers of inflammation and cardiovascular disease: a statement from the CDC and the American Heart Association. Circulation, 2003.
- Liu Z, et al. A new aging measure captures morbidity and mortality risk across diverse subpopulations from NHANES IV. PLOS Medicine, 2018.
- Diabetes Australia. Type 2 diabetes.
The Baseline Health Check is a blood test covering 70+ markers at one of 3,700+ collection centres. Your dietitian goes through your results with you and builds your plan. $99 a month, no minimum term.