
On this page
Check how many days the sensor recorded, then read three numbers: average glucose, time in the target range and glucose variability. Then open the days and meals behind them to find the pattern. Vively’s default target is 4–6 mmol/L and you can set a different one for each client. A CGM report shows patterns to talk through with your client. It doesn’t diagnose diabetes.
What a 14-day sensor gives you
Vively posts the sensor and a protective patch to your client, usually within 2–3 business days, and helps them pair it with the Vively app. For the next 14 days it records glucose around the clock. Your client logs meals, workouts, water and sleep in the same app, so every reading sits next to what they were doing.
Once your client shares their data, it appears in their record under Glucose, with the day-by-day detail in Day view and Meals.
1. Check the data is complete
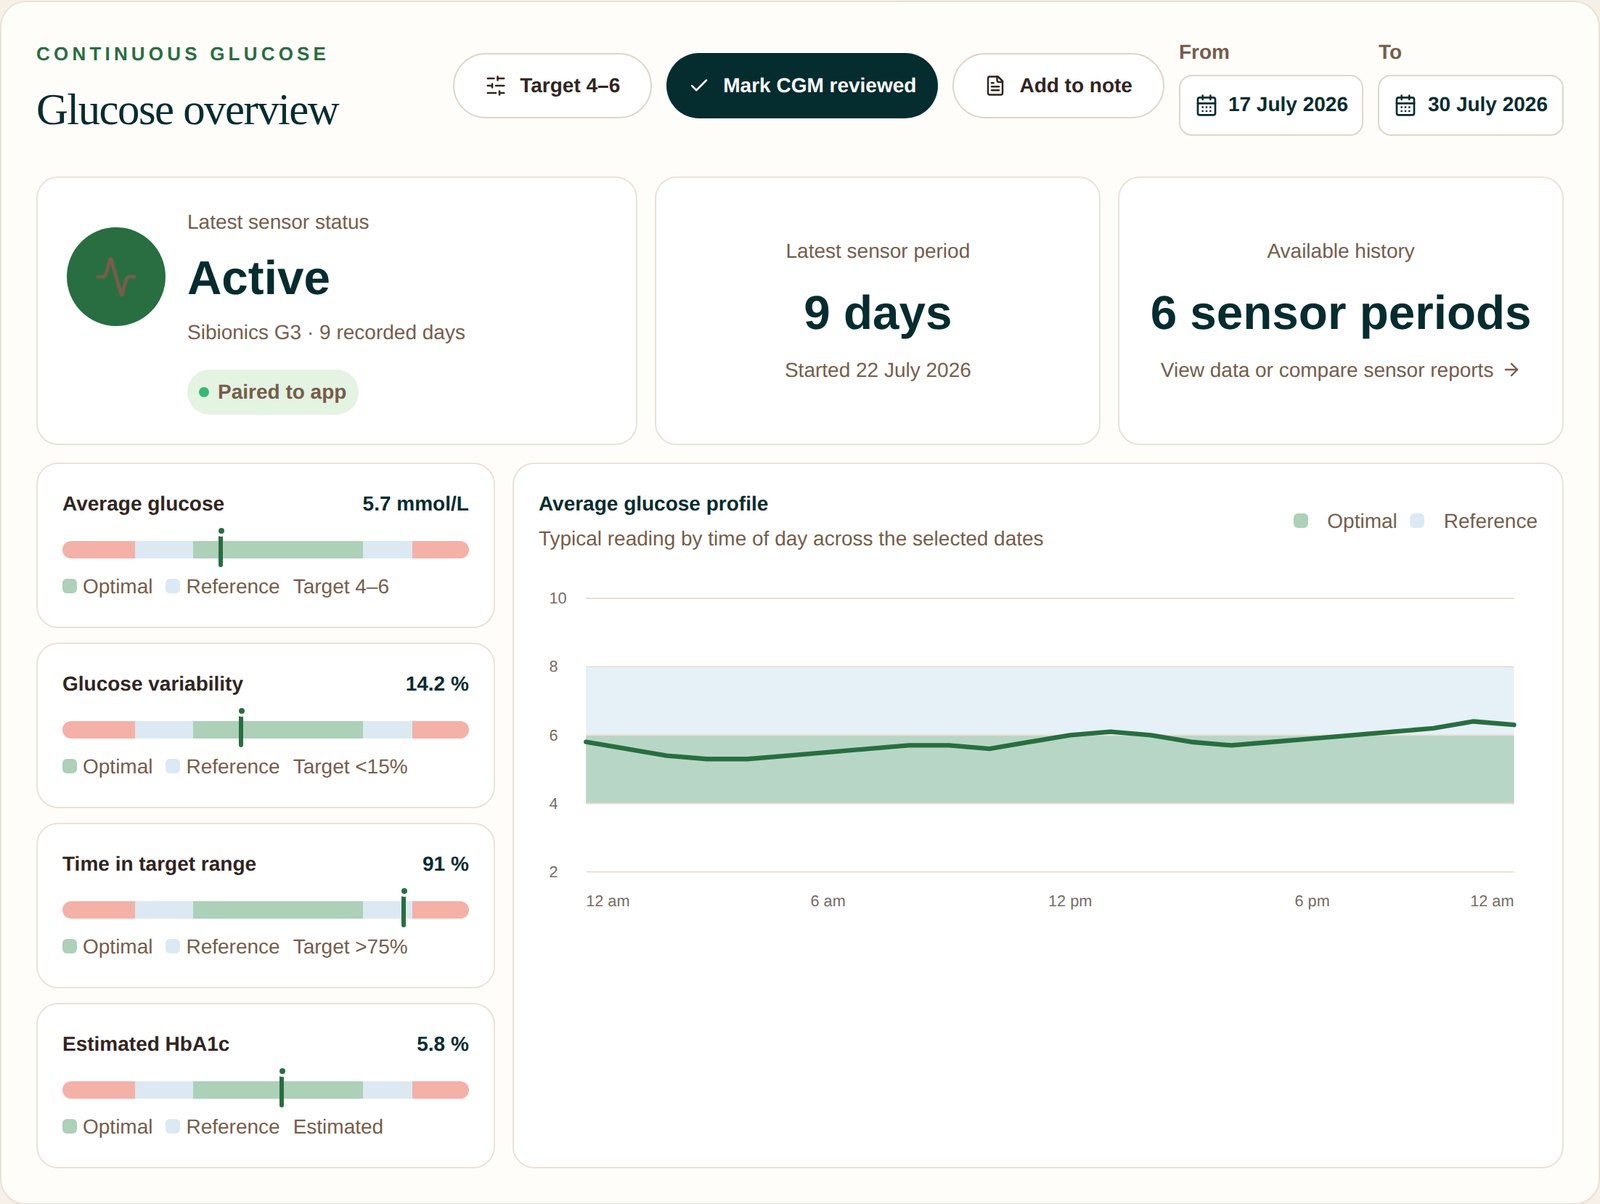
The top of the Glucose page shows the sensor’s status and how many days it recorded. Fourteen recorded days give you weekdays, weekends and a good spread of meals. If several days are missing, treat the averages with care and lean on the days you have. You can also change the date range to look at part of the period.
2. Read the three headline numbers
| Number | What it tells you | How Vively shows it |
|---|---|---|
| Average glucose | Your client’s overall glucose level across the sensor period, in mmol/L. | Beside the client’s target range |
| Time in target range | The share of readings inside the target. Higher means more of the day was spent in range. | A percentage, using the client’s target (4–6 mmol/L by default) |
| Glucose variability | How much glucose swings around its average. Lower means steadier glucose. | The coefficient of variation: the standard deviation divided by the average, as a percentage |
Each number sits on a range bar with its target, so you can see at a glance how far it is from where you’d like it. The average glucose profile underneath shows a typical day: what glucose usually does overnight, after breakfast and through the afternoon.
3. Find the pattern behind the numbers
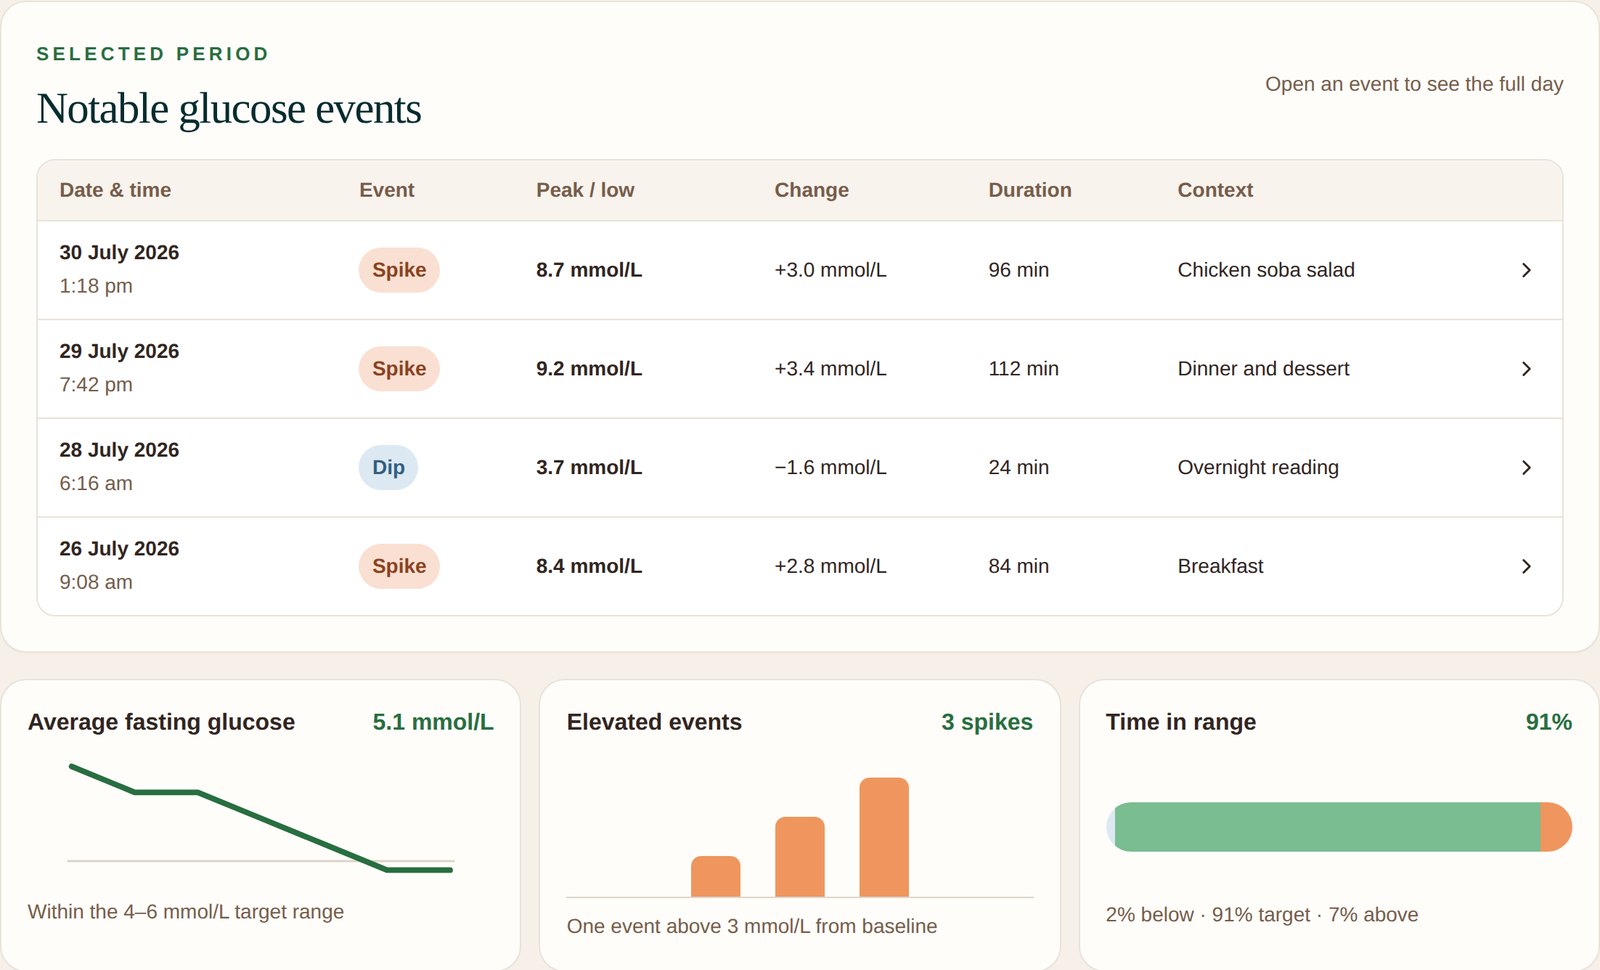
Below the overview, Notable glucose events lists the biggest spikes and dips in the period, with the peak or low, the change from baseline, how long it lasted and what your client logged at the time. Open an event to see the whole day. Underneath, three summaries show average fasting glucose, how many elevated events there were, and time in range split into below, in and above target.
Day view shows a one-day or three-day glucose chart with your client’s meals, workouts, water and sleep marked on the same timeline. That day’s average glucose, overnight fasting window and time in target sit above the chart. Select a marker to open the matching log.
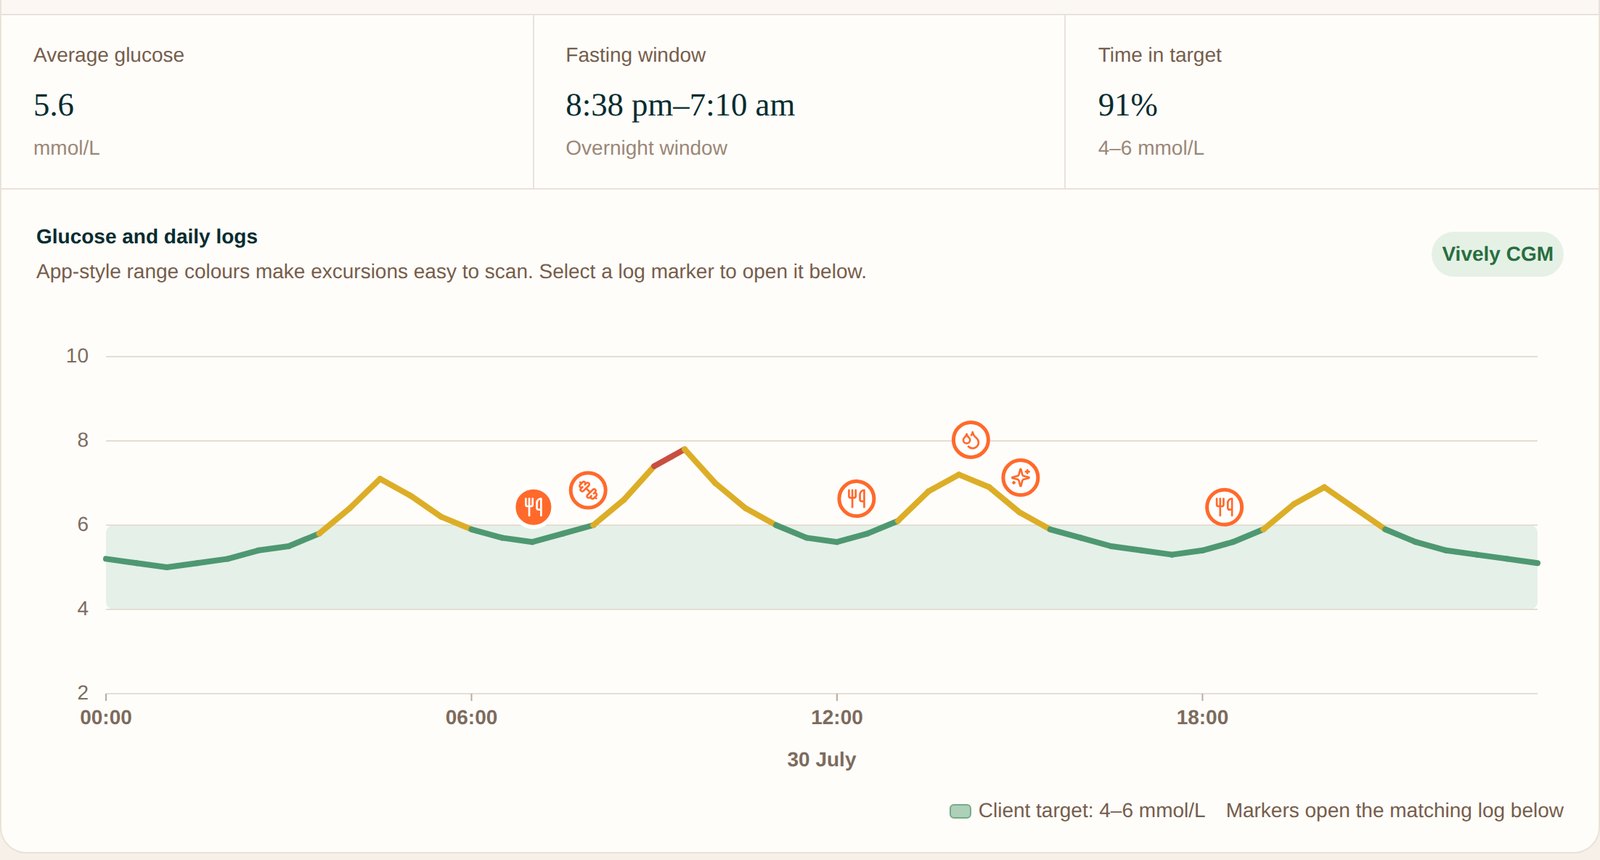
Look at when glucose rises and how long it takes to come back: after particular meals, overnight, first thing in the morning and around exercise. One unusual day matters less than a pattern that repeats.
4. Look at individual meals
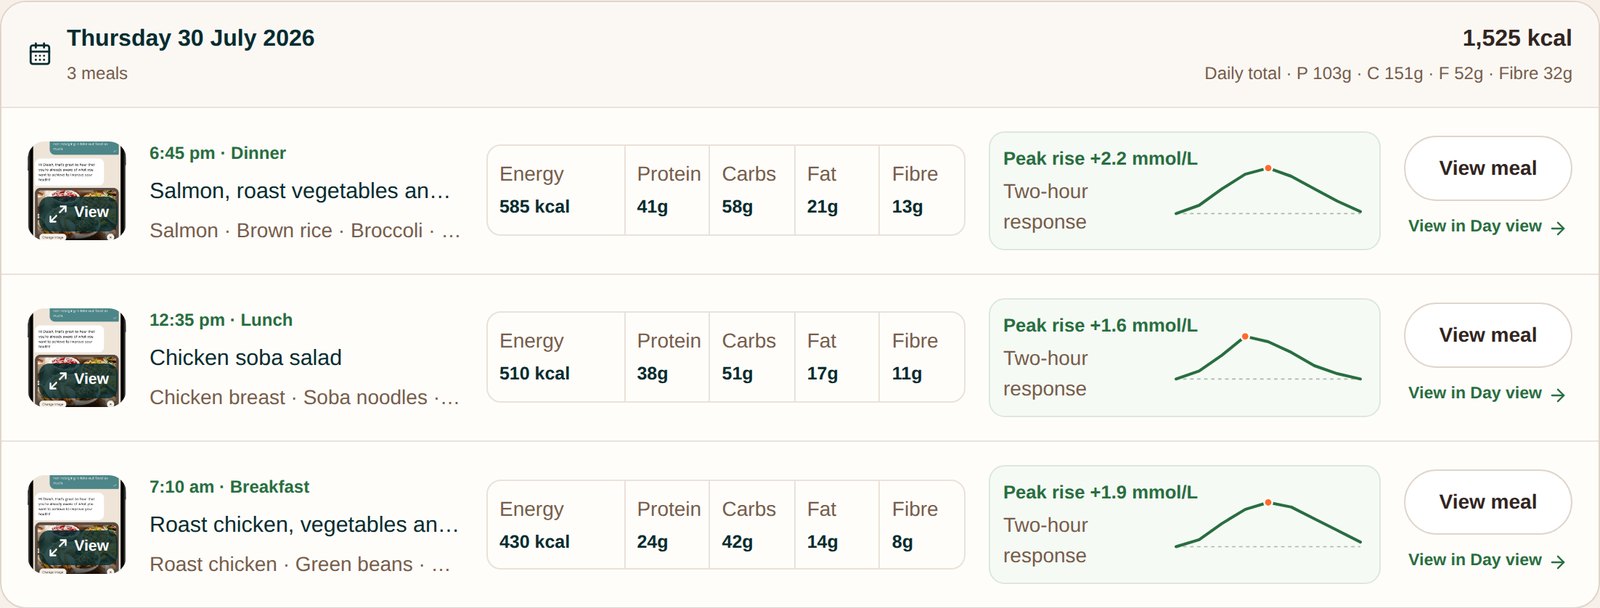
Meals lists every logged meal with its photo, ingredients, estimated energy and macros, and the two-hour glucose response with its peak rise. Compare meals your client eats often, such as two breakfasts with different amounts of protein or fibre. You can add a comment to any meal, and your client sees it on that meal in their app.
5. Agree on a change, then measure again
Pick one or two changes with your client rather than a long list. If the default target doesn’t suit them, set a client-specific target range. It updates in their app too and never changes the raw readings.
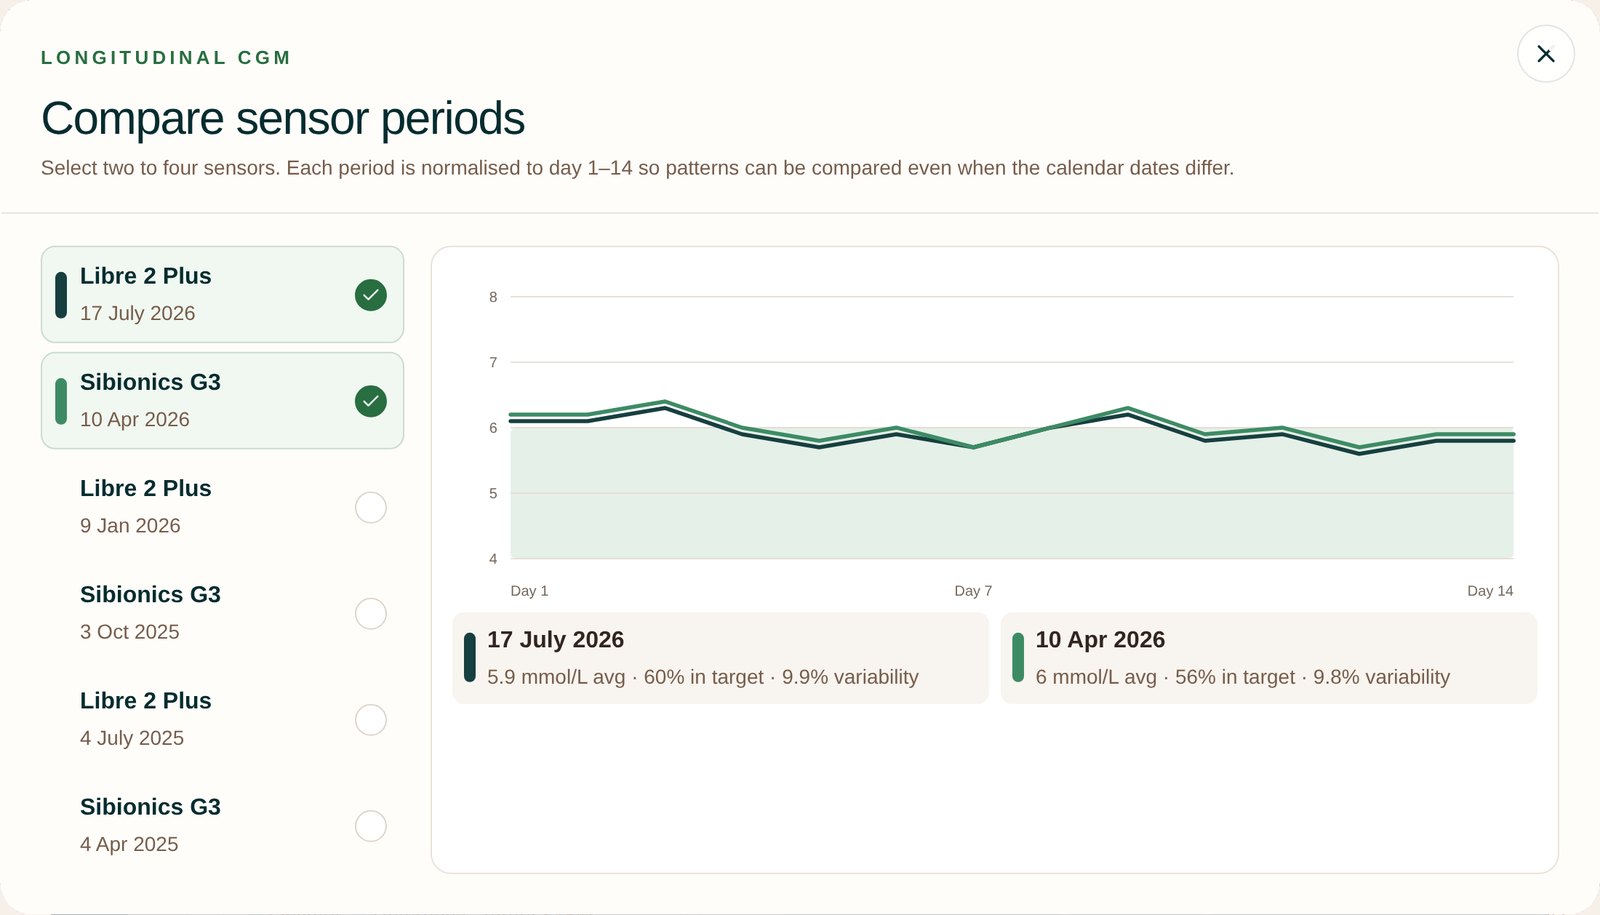
After the next sensor, open the sensor history to compare two to four sensor periods, lined up by sensor day, with the average, time in target and variability for each. You can also export a practitioner report for any sensor as a PDF.
Read it with blood tests
CGM shows what happens day to day. HbA1c reflects average glucose over the past two to three months, and fasting insulin and HOMA-IR show how hard the body is working to keep glucose steady. The Baseline Health Check includes HbA1c and fasting glucose, plus fasting insulin and HOMA-IR when the GP includes fasting insulin, so you can see both views in the same client record.
Keep in mind
- A CGM measures glucose in the fluid around cells, so readings run a little behind blood glucose
- Look for patterns across days rather than reacting to a single reading
- If your client has diabetes or takes glucose-lowering medicine, involve their GP or diabetes team before changing anything