Banana bread vs banana
Swap one for the other at the same meal on different days. In our members, the typical rise was 1.8 mmol/L for banana bread and 1.6 for banana.




We looked at Vively members who ate banana bread on its own while wearing a glucose sensor. Here is what happened, how it compares, and how to find out what it does to you.
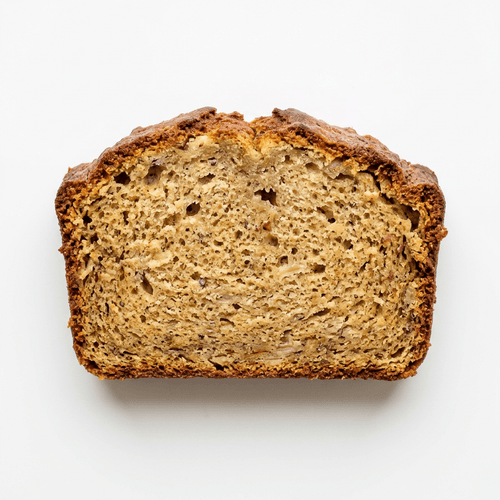
Half of members rose between 1.1 and 2.5 mmol/L.
Short answer: Banana bread raised blood sugar by a typical 1.8 mmol/L in 521 Vively members who wore a continuous glucose monitor (CGM) and logged it on its own. The middle half of members rose between 1.1 and 2.5 mmol/L. That was a bigger rise than a whole banana, because banana bread is closer to cake than fruit.
When you eat carbohydrate, your body breaks it down into glucose and your blood glucose rises. That is normal, because glucose is your body’s main fuel. Insulin then moves it out of your blood and into your cells, and your level comes back down.
A big rise is sometimes followed by a dip below where you started. In a study of 1,070 people, those with bigger dips after breakfast felt hungrier sooner and ate more over the rest of the day.
Bigger, more frequent rises mean your body releases more insulin. If your cells stop responding well to it (insulin resistance), your body has to make even more. Insulin resistance usually builds for 10 to 15 years before a standard glucose blood test picks it up.
Studies of people without diabetes have linked higher glucose levels, including two hours after a sugary drink, with a higher risk of heart disease. Higher rises after meals are also often one of the first changes on the way to type 2 diabetes.
Glucose is meant to go up after you eat. What matters is your pattern over weeks: how high you go, how often, and how quickly you come back down. That pattern is personal, so measuring it beats guessing.
If you have diabetes or take medicine that lowers glucose, talk to your doctor before changing how you eat.
Two groups of members in the Sydney and Melbourne time zones, each eating one food on its own: 289 for banana bread and 1340 for banana. These are their average curves. Drag across a chart to read it.

average peak for banana, give or take
less glucose under the curve for banana
typical rise in mmol/L, banana bread vs banana
Average curves look gentler than any one person’s, because people peak at different times. These are different groups of people, so treat it as a guide, not a verdict.
25% barely moved. After banana bread on its own, 25% of members rose less than 1 mmol/L and 25% rose 2.5 or more. Which group are you in?
Test it on yourselfLine up 521 members from smallest to biggest typical rise after banana bread, then pick ten people evenly spaced along the line. Same food, very different curves.
barely moved, with a typical rise under 1.0 mmol/L
rose 2.5 mmol/L or more
Most cafe banana bread is a sweet loaf made from white flour, sugar and banana, often toasted and served with butter. A thick cafe slice is a big serve. Members' curves peaked around 30 minutes after eating and stayed raised longer than for a banana.
Homemade versions vary a lot depending on the flour and how much sugar goes in.
Portion size, what you ate earlier, sleep, stress, movement and your menstrual cycle all change the curve too. That is why we built Vively around testing your own meals instead of handing out food lists.
Five quick rounds using our members’ data. How well do you know your banana bread?
Typical rise in mmol/L when each food was eaten on its own. Every food has at least 30 members behind it. Tap a food to see its page.
 Weet-Bix2.5
 Hot cross bun2.2
 Sushi2.2
 Porridge2.1
 Turkish bread2.1
 Fried rice2.0
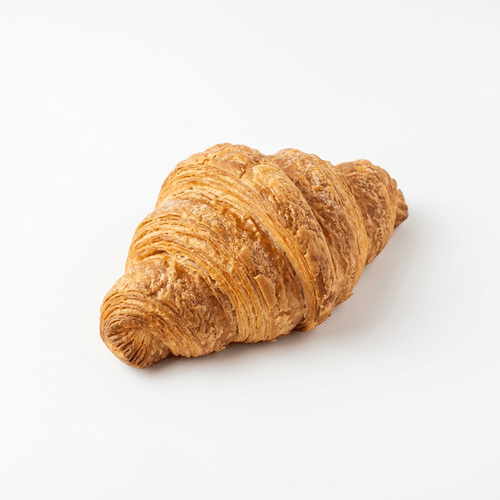 Croissant1.9Banana bread1.8
 Jasmine rice1.8
 Meat pie1.8
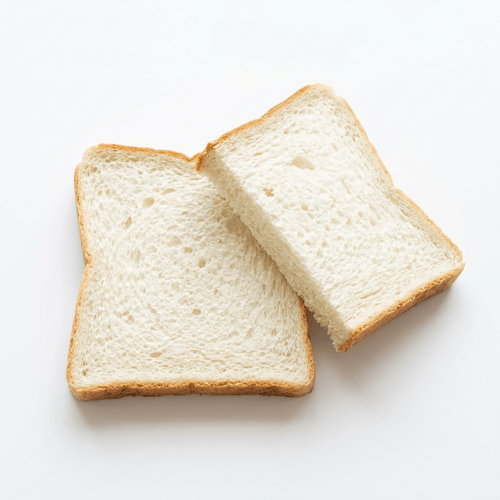 White bread1.8
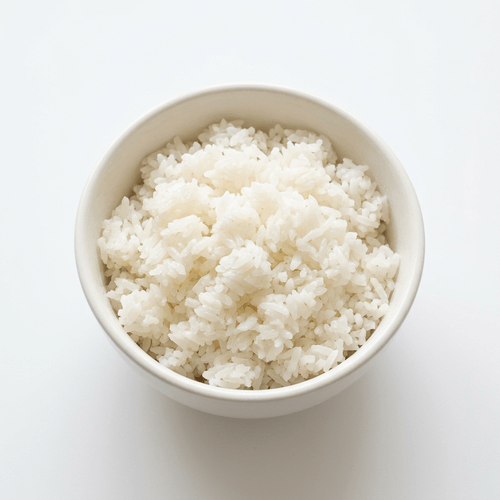 White rice1.8
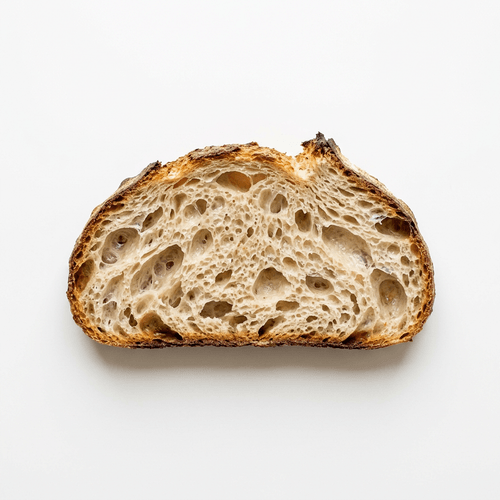 Sourdough1.7
 Sweet potato1.7Banana1.6
 Brown rice1.6
 Pizza1.6
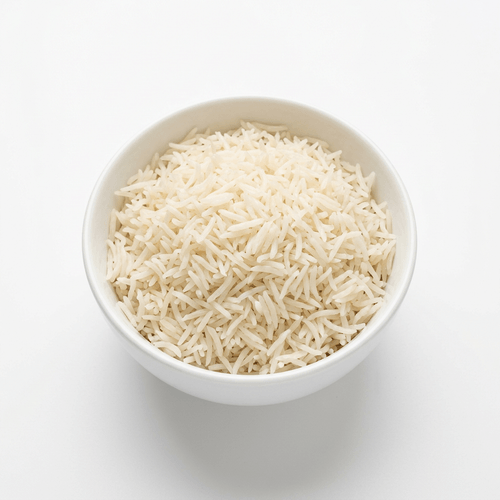 Basmati rice1.5
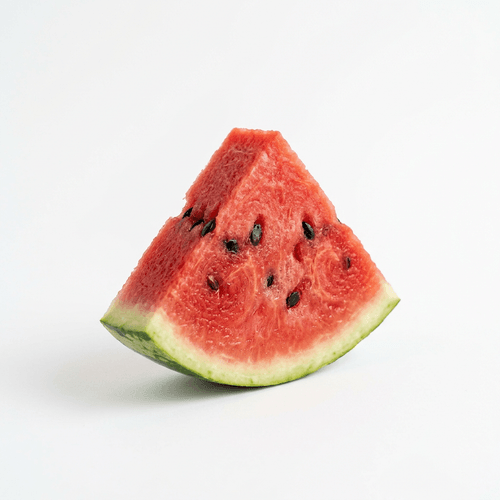 Watermelon1.4
 Pasta1.3
See all 38 foods on our glucose spikes page.
Averages only get you so far. These are the tests our members run with their sensors.
Swap one for the other at the same meal on different days. In our members, the typical rise was 1.8 mmol/L for banana bread and 1.6 for banana.
Share a slice, or have half with a flat white, and check your own curve.
After the same meal, sit one day and take a 10-minute walk the next. Compare how high you go.
Wear a CGM with Vively and see the rise, the peak and the recovery for every meal you log. Then try a swap and compare the two curves side by side.
Get your CGM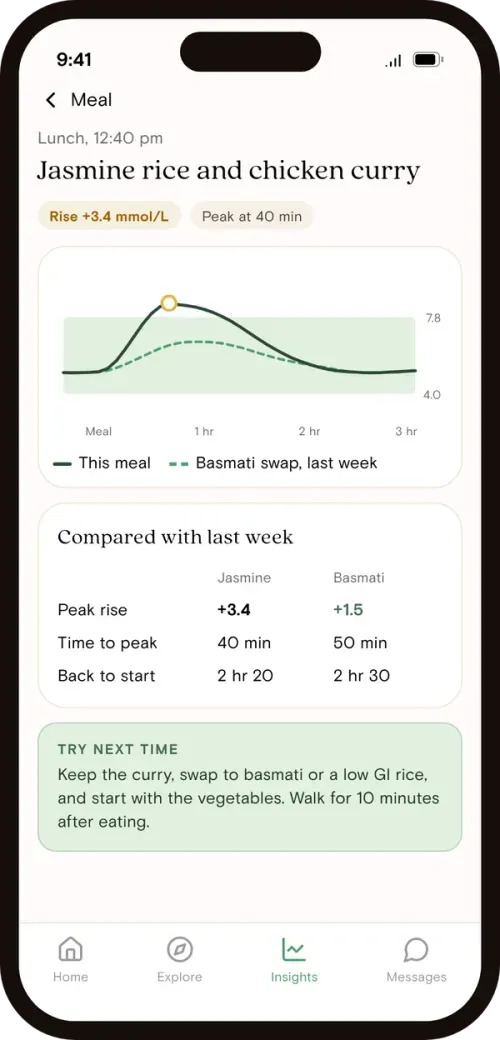
For many people it does. 521 Vively members wearing a CGM rose a typical 1.8 mmol/L after banana bread on its own, more than after a whole banana (1.6). The middle half rose between 1.1 and 2.5 mmol/L.
Most cafe banana bread is closer to cake than bread: white flour and sugar with some banana. It can still be a treat. Homemade versions with wholemeal flour, less sugar and nuts are a different food, and you can test them with a CGM.
We don't have enough members logging muffins on their own to compare fairly. Both are usually made with white flour and sugar, so they would be expected to behave similarly.
There is no official cut-off for a spike in people without diabetes. In a 2019 study of healthy adults who wore CGMs, glucose stayed between 3.9 and 7.8 mmol/L for about 96% of the day. Rises after meals are normal. How high you go, how long you stay there and your pattern over weeks matter more.
We used meals logged in the Vively app by members wearing a CGM between January 2022 and October 2026, leaving out members who told us they have type 2 diabetes, and our own staff. The rise is the highest reading in the two hours after eating, minus the member’s average for the four hours before. If glucose fell, we counted the rise as zero. We took each member’s own median first, then the median across members. “On its own” means the food was the only item logged for that meal. The curves use members in the Sydney and Melbourne time zones, meals since January 2023 and each member’s three most recent meals of each kind. Data is de-identified and only shown when at least 30 members contribute. This is observational app data, not a controlled GI test, and portions vary.
This is observational data from real meals, not medical advice.
.avif)


.svg)


Vively is a general wellness platform and does not provide medical advice, diagnosis, or treatment. Any information, insights or guidance offered through our app, website, programs, or coaches is for educational and informational purposes only and should not be considered a substitute for professional medical advice or care. Always consult a qualified healthcare provider before making any health-related decisions.
We acknowledge the Traditional Custodians of the lands where we live and work, the Gadigal of the Eora Nation. We pay our respects to their Elders past and present.