



Among 6,161 Vively members, median total cholesterol rose with age in women, from 4.5 mmol/L at 18 to 29 to 5.7 at 60 and over. In men it rose from 4.6 to 5.2 by their 40s, then levelled off. After 50, women overtook men: at 60 and over, 42% of women had an LDL above 3.5 mmol/L, against 37% of men.
Cholesterol tends to rise through adult life, and the pattern differs between women and men. Men's levels climb earlier. Women's stay lower until around menopause, then rise faster and end up higher.
This guide shows total cholesterol, LDL and HDL by age and sex from the first blood test of 6,161 Vively members, next to the ranges Australian labs use and the Vively optimal ranges, so you can see where a result sits and what usually moves it.
Total cholesterol, LDL, HDL, non-HDL and triglycerides are all in the Baseline Health Check, read with your HbA1c, insulin and liver markers.
Median and middle 50% (in brackets) for total cholesterol, LDL and HDL, and the share with LDL above 3.5 mmol/L. 3,840 women.
| Age | Women | Total cholesterol (mmol/L) | LDL (mmol/L) | LDL above 3.5 | HDL (mmol/L) |
|---|---|---|---|---|---|
| 18 to 29 | 270 | 4.5 (4.0 to 5.1) | 2.5 (2.1 to 3.0) | 10% | 1.6 (1.4 to 1.9) |
| 30 to 39 | 1,005 | 4.7 (4.2 to 5.3) | 2.6 (2.2 to 3.2) | 14% | 1.6 (1.4 to 1.9) |
| 40 to 49 | 1,180 | 5.0 (4.5 to 5.6) | 2.8 (2.4 to 3.4) | 22% | 1.7 (1.4 to 1.9) |
| 50 to 59 | 879 | 5.5 (4.8 to 6.2) | 3.2 (2.6 to 3.8) | 38% | 1.7 (1.4 to 2.0) |
| 60 and over | 506 | 5.7 (4.9 to 6.5) | 3.3 (2.8 to 4.1) | 42% | 1.7 (1.5 to 2.0) |
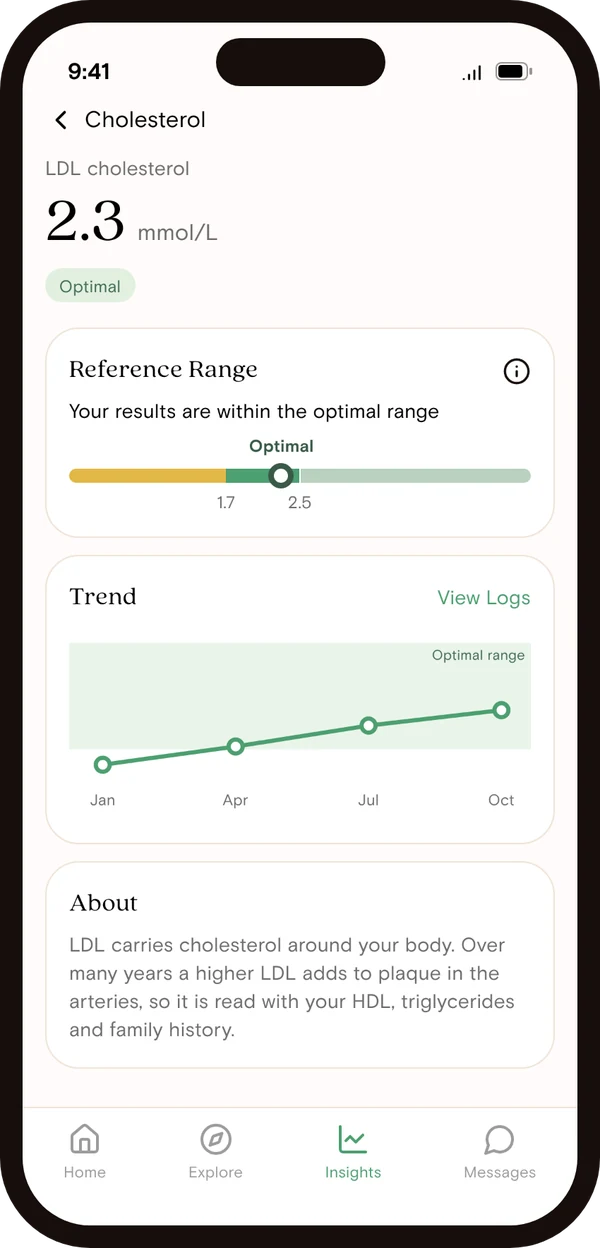
Range used in the Vively app: total cholesterol 3.6 to 5.6 mmol/L (Vively optimal 3.9 to 4.9), LDL up to 3.5 (Vively optimal 1.7 to 2.5), HDL above 1.0 (Vively optimal 1.2 to 3.0). Labs set their own ranges, so check the range on your report.
Median and middle 50% (in brackets) for total cholesterol, LDL and HDL, and the share with LDL above 3.5 mmol/L. 2,321 men.
| Age | Men | Total cholesterol (mmol/L) | LDL (mmol/L) | LDL above 3.5 | HDL (mmol/L) |
|---|---|---|---|---|---|
| 18 to 29 | 267 | 4.6 (4.0 to 5.2) | 2.7 (2.3 to 3.3) | 17% | 1.4 (1.2 to 1.6) |
| 30 to 39 | 659 | 4.9 (4.3 to 5.5) | 3.0 (2.5 to 3.6) | 26% | 1.4 (1.2 to 1.6) |
| 40 to 49 | 711 | 5.2 (4.5 to 5.9) | 3.2 (2.6 to 3.9) | 37% | 1.3 (1.1 to 1.6) |
| 50 to 59 | 417 | 5.2 (4.4 to 6.1) | 3.2 (2.6 to 4.0) | 40% | 1.4 (1.1 to 1.6) |
| 60 and over | 267 | 5.1 (4.4 to 5.9) | 3.2 (2.4 to 3.8) | 37% | 1.4 (1.2 to 1.7) |
Range used in the Vively app: total cholesterol 3.6 to 5.6 mmol/L (Vively optimal 3.9 to 4.9), LDL up to 3.5 (Vively optimal 1.7 to 2.5), HDL above 1.0 (Vively optimal 1.0 to 2.5). Labs set their own ranges, so check the range on your report.
Women’s LDL rose most after 50. At 60 and over, more women (42%) than men (37%) had an LDL above 3.5 mmol/L.
% with LDL above 3.5 mmol/L
| Women | Men | |
|---|---|---|
| 18 to 29 | 10% (n=268) | 17% (n=264) |
| 30 to 39 | 14% (n=996) | 26% (n=651) |
| 40 to 49 | 22% (n=1,172) | 37% (n=699) |
| 50 to 59 | 38% (n=871) | 40% (n=413) |
| 60+ | 42% (n=499) | 37% (n=260) |
% with LDL above 2.5 mmol/L (the Vively optimal limit)
| Women | Men | |
|---|---|---|
| 18 to 29 | 48% (n=268) | 59% (n=264) |
| 30 to 39 | 55% (n=996) | 72% (n=651) |
| 40 to 49 | 66% (n=1,172) | 77% (n=699) |
| 50 to 59 | 79% (n=871) | 76% (n=413) |
| 60+ | 82% (n=499) | 70% (n=260) |
% with total cholesterol above 5.5 mmol/L
| Women | Men | |
|---|---|---|
| 18 to 29 | 13% (n=270) | 15% (n=267) |
| 30 to 39 | 18% (n=1,005) | 25% (n=659) |
| 40 to 49 | 26% (n=1,180) | 36% (n=711) |
| 50 to 59 | 45% (n=879) | 42% (n=417) |
| 60+ | 56% (n=506) | 37% (n=267) |
Median LDL rose steadily in women, from 2.5 to 3.3 mmol/L, and passed men’s after 50. In men it reached 3.2 by the 40s and stayed there. The line is the median at each age. The darker band is the middle 50%, the lighter band the middle 90% of members. The dotted line is the median for the other sex. 6,093 members.
| Group (mmol/L) | Members | 5th | 10th | 25th | Median | 75th | 90th | 95th |
|---|---|---|---|---|---|---|---|---|
| Women 18 to 29 | 268 | 1.5 | 1.7 | 2.0 | 2.5 | 3.0 | 3.5 | 3.8 |
| Women 30 to 39 | 996 | 1.7 | 1.9 | 2.2 | 2.6 | 3.2 | 3.7 | 4.1 |
| Women 40 to 49 | 1,172 | 1.8 | 2.0 | 2.4 | 2.8 | 3.4 | 4.0 | 4.4 |
| Women 50 to 59 | 871 | 1.9 | 2.1 | 2.6 | 3.2 | 3.8 | 4.5 | 5.0 |
| Women 60+ | 499 | 1.7 | 2.1 | 2.8 | 3.3 | 4.1 | 4.9 | 5.3 |
| Men 18 to 29 | 264 | 1.8 | 1.9 | 2.3 | 2.7 | 3.3 | 3.8 | 4.2 |
| Men 30 to 39 | 651 | 1.9 | 2.1 | 2.5 | 3.0 | 3.6 | 4.3 | 4.7 |
| Men 40 to 49 | 699 | 1.8 | 2.1 | 2.6 | 3.2 | 3.9 | 4.5 | 4.9 |
| Men 50 to 59 | 413 | 1.6 | 2.0 | 2.6 | 3.2 | 4.0 | 4.7 | 5.3 |
| Men 60+ | 260 | 1.4 | 1.7 | 2.4 | 3.2 | 3.8 | 4.5 | 5.1 |
Type your LDL cholesterol to see where it sits among Vively members of your sex and age.
| Group (mmol/L) | Members | 5th | 10th | 25th | Median | 75th | 90th | 95th |
|---|---|---|---|---|---|---|---|---|
| Women 18 to 29 | 268 | 1.5 | 1.7 | 2.0 | 2.5 | 3.0 | 3.5 | 3.8 |
| Women 30 to 39 | 996 | 1.7 | 1.9 | 2.2 | 2.6 | 3.2 | 3.7 | 4.1 |
| Women 40 to 49 | 1,172 | 1.8 | 2.0 | 2.4 | 2.8 | 3.4 | 4.0 | 4.4 |
| Women 50 to 59 | 871 | 1.9 | 2.1 | 2.6 | 3.2 | 3.8 | 4.5 | 5.0 |
| Women 60+ | 499 | 1.7 | 2.1 | 2.8 | 3.3 | 4.1 | 4.9 | 5.3 |
| Men 18 to 29 | 264 | 1.8 | 1.9 | 2.3 | 2.7 | 3.3 | 3.8 | 4.2 |
| Men 30 to 39 | 651 | 1.9 | 2.1 | 2.5 | 3.0 | 3.6 | 4.3 | 4.7 |
| Men 40 to 49 | 699 | 1.8 | 2.1 | 2.6 | 3.2 | 3.9 | 4.5 | 4.9 |
| Men 50 to 59 | 413 | 1.6 | 2.0 | 2.6 | 3.2 | 4.0 | 4.7 | 5.3 |
| Men 60+ | 260 | 1.4 | 1.7 | 2.4 | 3.2 | 3.8 | 4.5 | 5.1 |
Type your total cholesterol to see where it sits among Vively members of your sex and age.
| Group (mmol/L) | Members | 5th | 10th | 25th | Median | 75th | 90th | 95th |
|---|---|---|---|---|---|---|---|---|
| Women 18 to 29 | 270 | 3.4 | 3.6 | 4.0 | 4.5 | 5.1 | 5.6 | 6.2 |
| Women 30 to 39 | 1,005 | 3.6 | 3.8 | 4.2 | 4.7 | 5.3 | 5.9 | 6.2 |
| Women 40 to 49 | 1,180 | 3.8 | 4.1 | 4.5 | 5.0 | 5.6 | 6.2 | 6.6 |
| Women 50 to 59 | 879 | 3.9 | 4.3 | 4.8 | 5.5 | 6.2 | 6.8 | 7.3 |
| Women 60+ | 506 | 3.8 | 4.3 | 4.9 | 5.7 | 6.5 | 7.4 | 7.9 |
| Men 18 to 29 | 267 | 3.5 | 3.6 | 4.0 | 4.6 | 5.2 | 5.7 | 6.2 |
| Men 30 to 39 | 659 | 3.5 | 3.8 | 4.3 | 4.9 | 5.5 | 6.3 | 6.8 |
| Men 40 to 49 | 711 | 3.6 | 3.9 | 4.5 | 5.2 | 5.9 | 6.6 | 7.1 |
| Men 50 to 59 | 417 | 3.4 | 3.8 | 4.4 | 5.2 | 6.1 | 6.9 | 7.5 |
| Men 60+ | 267 | 3.2 | 3.6 | 4.4 | 5.1 | 5.9 | 6.9 | 7.4 |
These are Vively members who chose to have a blood test, so they may not represent all Australians. We don’t know who was taking cholesterol-lowering medicine. A member median is not a target or a normal range.
In women, median total cholesterol went from 4.5 mmol/L at 18 to 29, to 5.0 in their 40s, then 5.5 in their 50s and 5.7 at 60 and over. Median LDL followed the same path, from 2.5 to 3.3 mmol/L. The share of women with an LDL above 3.5 mmol/L went from 10% under 30 to 22% in their 40s and 42% at 60 and over.
In men, cholesterol rose earlier and then held steady. Median total cholesterol went from 4.6 mmol/L under 30 to 5.2 in their 40s and 50s, and median LDL from 2.7 to 3.2 mmol/L. About 4 in 10 men aged 40 and over had an LDL above 3.5 mmol/L.
HDL, the "good" cholesterol, barely changed with age. Women's median sat at 1.6 to 1.7 mmol/L and men's at 1.3 to 1.4 mmol/L in every age group. HDL below 1.0 mmol/L was rare in women (about 1%) and affected 5% to 8% of men.
Against the tighter Vively optimal range for LDL (1.7 to 2.5 mmol/L), most members sat above it from their 30s on: 55% of women and 72% of men in their 30s, and 82% of women at 60 and over.
Each lab sets its own reference range, so read your result against the range printed on your report. The ranges used in the Vively app are:
| Range used in the Vively app | Vively optimal range | |
|---|---|---|
| Total cholesterol | 3.6 to 5.6 mmol/L | 3.9 to 4.9 mmol/L |
| LDL cholesterol | Up to 3.5 mmol/L | 1.7 to 2.5 mmol/L |
| HDL cholesterol | Above 1.0 mmol/L | Women 1.2 to 3.0, men 1.0 to 2.5 mmol/L |
| Non-HDL cholesterol | Up to 3.4 mmol/L | Below 3.0 mmol/L |
| Non-HDL as a share of total cholesterol | No set range | Below 0.80 |
| Triglycerides | 0.5 to 2.1 mmol/L | 0.5 to 1.2 mmol/L |
There is no single "normal" cholesterol for your age. Australia's 2023 guideline for heart risk asks doctors to look at your overall chance of a heart attack or stroke in the next five years, using age, sex, blood pressure, smoking, diabetes and cholesterol together. A level that needs no treatment in one person can need treatment in another.
The Vively optimal ranges are tighter than lab limits. They are what we aim for to support long-term heart and metabolic health. They are not diagnostic cut-offs or treatment targets.
Oestrogen helps the liver clear LDL from the blood. As oestrogen falls around menopause, LDL and total cholesterol tend to rise, often within a few years. In our data, women's median LDL went from 2.8 mmol/L in their 40s to 3.2 in their 50s, the biggest jump of any age step for either sex.
Age alone doesn't explain it. Among Vively women aged 45 to 55, 40% of those past menopause had an LDL above 3.5 mmol/L, against 24% of those in perimenopause (314 and 506 women). Our data story on cholesterol after menopause has the full comparison, and our perimenopause blood test guide covers what to test through that change.
Men's LDL rose fastest between their 20s and 40s. Weight gain around the middle, less activity and a diet higher in saturated fat all tend to push LDL up in these years. Men also had lower HDL at every age, which is one reason a man's heart risk usually starts climbing earlier than a woman's.
Do you need to fast? Not for total cholesterol, LDL or HDL. Fasting mainly affects triglycerides. The Baseline Health Check is a fasting test because of glucose, insulin and triglycerides, so fast overnight.
HDL helps carry cholesterol back to the liver, and a low HDL goes with higher heart risk. Very high HDL doesn't add protection. In a Danish study of 116,508 adults, death rates were lowest with HDL around 1.9 mmol/L in men and 2.4 mmol/L in women, and rose again at very high levels. That is why the Vively optimal range for HDL has an upper limit (1.0 to 2.5 mmol/L for men, 1.2 to 3.0 for women). Fewer than 1% of Vively members sat above it.
Non-HDL cholesterol is your total cholesterol minus HDL. It counts every particle that can build up in artery walls, including those that carry triglycerides, so it is useful when triglycerides are high.
Dividing non-HDL by total cholesterol shows how much of your cholesterol is in these particles. The Vively optimal is below 0.80. In Vively members, a result of 0.80 or above was uncommon in women (3% to 7%) and more common in men, reaching 18% of men in their 40s.
A total cholesterol of 6.0 mmol/L is above the range used in the Vively app (up to 5.6) and above the 5.5 that many Australian labs flag. In Vively members, 56% of women and 37% of men aged 60 and over had a total cholesterol above 5.5, so it is common, but it still adds to long-term heart risk.
An LDL of 3.5 mmol/L is at the top of the range used in the Vively app and above the Vively optimal of 1.7 to 2.5. Whether it needs treatment depends on your overall heart risk, which your GP can work out. An LDL of 5.0 mmol/L or more is high enough to look for a genetic cause.
| Pattern | What it can mean |
|---|---|
| High LDL, normal triglycerides and HDL | Often diet or genes. Very high LDL can point to familial hypercholesterolaemia |
| High triglycerides, low HDL, raised HbA1c or HOMA-IR | Often linked to insulin resistance. See the TG/HDL ratio |
| High LDL with a raised TSH | An underactive thyroid can raise cholesterol. Needs GP review |
| Normal LDL, high ApoB | More small LDL particles than the LDL number suggests |
| Any LDL, high lipoprotein(a) | An inherited risk factor that lifestyle doesn't change. Worth knowing once |
Lifestyle changes can lower LDL, often by about 10% to 20%, and they work best combined.
Retest about three months after a change, so you're comparing like with like. If your heart risk is high or your LDL is very high, lifestyle changes may not be enough on their own, and your GP may talk to you about medicine.
See your GP if your LDL is 5.0 mmol/L or more, your total cholesterol is 7.5 mmol/L or more, a close relative had heart disease young, or you have other risk factors such as diabetes, high blood pressure or smoking. Australian guidelines recommend a heart risk check from age 45, or from 30 for Aboriginal and Torres Strait Islander people. Vively doesn't diagnose, manage or treat high cholesterol or heart disease. If you're concerned about a result, speak with your GP.
Total cholesterol, LDL, HDL, non-HDL and triglycerides are in the Baseline Health Check, with HbA1c, fasting insulin, HOMA-IR, TSH and liver and kidney markers. A GP from our network signs your request after a short telehealth consult, so you don't need to visit your own GP first. You have one blood draw at one of our 3,700+ partner collection centres, and your results arrive in the Vively app, usually within a few days. A Vively practitioner reads your cholesterol with your metabolic markers, and members have a targeted re-test after 3 months. Get your Baseline Health Check.
There's no age-specific normal on Australian lab reports: labs use the same range for every adult, often total cholesterol up to 5.5 mmol/L and LDL up to 3.5. Among Vively members, median total cholesterol rose from 4.5 mmol/L in women under 30 to 5.7 at 60 and over, and from 4.6 to 5.2 in men by their 40s.
The range used in the Vively app is total cholesterol 3.6 to 5.6 mmol/L, LDL up to 3.5 and HDL above 1.0. Among 3,840 Vively women, median total cholesterol was 4.5 to 5.0 mmol/L under 50 and 5.5 to 5.7 after 50. The Vively optimal range for HDL in women is 1.2 to 3.0 mmol/L.
The same lab ranges apply to men. Among 2,321 Vively men, median total cholesterol was 4.6 mmol/L under 30 and 5.1 to 5.2 from their 40s on, and median HDL was 1.3 to 1.4 mmol/L. The Vively optimal range for HDL in men is 1.0 to 2.5 mmol/L.
Yes, for most adults. In Vively members, women's median LDL rose from 2.5 mmol/L under 30 to 3.3 at 60 and over, with the biggest rise around menopause. Men's LDL rose from 2.7 to 3.2 mmol/L by their 40s and then held steady.
Yes. A total cholesterol of 6.0 mmol/L is above the range most Australian labs use, though it is common: 56% of Vively women aged 60 and over were above 5.5. What it means for you depends on your LDL, HDL and overall heart risk, which your GP can work out.
No. Total cholesterol, LDL and HDL change very little after eating. Triglycerides rise after a meal, so some tests ask you to fast. The Baseline Health Check is a fasting test because it also measures glucose, insulin and triglycerides.
Vively supports preventative health and health optimisation. It does not replace your GP, emergency care or specialist medical advice.





Vively is a general wellness platform and does not provide medical advice, diagnosis, or treatment. Any information, insights or guidance offered through our app, website, programs, or coaches is for educational and informational purposes only and should not be considered a substitute for professional medical advice or care. Always consult a qualified healthcare provider before making any health-related decisions.
We acknowledge the Traditional Custodians of the lands where we live and work, the Gadigal of the Eora Nation. We pay our respects to their Elders past and present.